| Glow Worms - a detailed summary 2013 |
| 2013 Glow Worm sightings |
| Clipstone Old Quarter female Glow Worm data 2013 |
| A comparison of Glow Worm colonies at Clipstone Old Quarter and Great Orme in 2013 |
| 2013 provided
us with perhaps our most interesting glowing season in
five years study and once again, the season's events were
unpredictable. It was a dramatically short season, with
adults eventually appearing two weeks later than the
average first date and then finishing some two weeks
early. By the end of July, it was suddenly all over. Whilst it may seem from our opening paragraph that this was another successful year for Glow Worms, the real story is pretty much the opposite. |
||
| ... | ||
| The Glow Worm - a
continuing decline For several years now, we have been arguing that Glow Worms are in decline. Sure enough, there are some new sites still being discovered across parts of Nottinghamshire, but the argument for decline is still very much in evidence. A poor response to the Nottinghamshire Glow Worm survey, failed to fill in any of the glaring gaps on the county map and the present stronghold is the Clumber Park area. Although there are several sites encompassed by the Sherwood Forest NNR, Glow Worms are certainly more widespread at Clumber, despite habitat being largely the same. There was some good news, with the discovery of a new Glow Worm colony at Harlow Wood near Mansfield. The colony produced over 100 females throughout the course of the year and is to be monitored by the observers in future years. However, the Sherwood Forest colonies are generally not doing so well. |
 |
|
| ... | ||
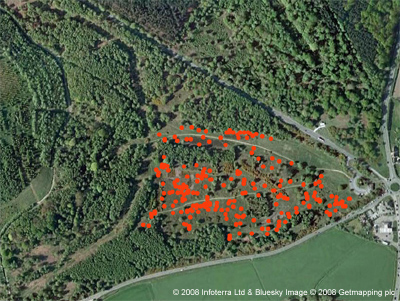
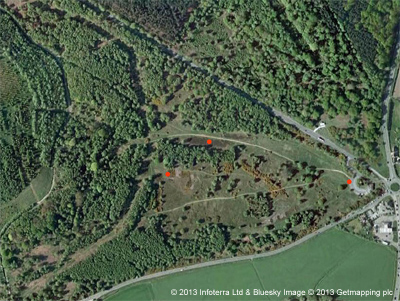
| Back in 2008, we recorded well over 200 females at Sherwood Heath SSSI on two occasions, but numbers have continued to drop dramatically since then. The two accompanying maps on the right show the locations of female Glow Worms at Sherwood Heath in 2008 (above) and the single females recorded in 2011, 2012 and 2013 (below). | ||
| ... | ||
| After the first Glow Worm
appeared at Clipstone Old Quarter, we immediately began a
short series of surveys at Sherwood Heath, only to find
just one female, the same number as in recent years,
although we have not given it the continuous coverage we
would have liked. Conditions on Sherwood Heath have
declined so much, that the site seems to have become
unsuitable. The cause of this decline? Well we strongly believe that this natural decline is being accelerated by site management. There are a combination of factors which have led to a drying out of the site, which in turn affects the populations of Slugs and Snails. These are tree/scrub clearance and Bracken control, via Bracken rolling and herbicidal spraying, both aspects of site management which are carried out by several tonnes of John Deere tractor. Site management clearly is having an affect on the invertebrates at this site, with other species noted as declining in numbers. |
 |
|
| ... | ||
| Overview
of the 2013 Clipstone Old Quarter survey results and data
Despite a new site record count of 90, Glow Worm numbers declined at Clipstone Old Quarter for the second year in succession. In just two years, female numbers have dropped by a total of 300. The end of season total of 495 females may still seem an excellent one, but the current population trend is downwards. Admittedly, the Glow Worm population has little direct correllation with the populations of Saproxylic invertebrates and ancient woodland for which Sherwood Forest attained its NNR status, but if one species is not doing well, then others are certainly going the same way. Glow Worms actually make a good indicator species, to show how well many invertebrates are doing on a site. The big advantage is that the Glow Worm is probably the only invertebrate able to provide the recorder with an accurate site population, spread and density of population data. Because of their bioluminescence, every female will be recorded if a site is worked/surveyed consistantly. No other species we are aware of, can provide that opportunity to the entomologist or ecologist. Sweep-netting, foliage beating, vacuum sampling, or even running a moth trap, will only ever provide a small sample of any species on site, which is susceptible to a range of influencing factors. |
||
| ... | ||
 |
 |
|
| ... | ||
| Natural
England believe that Glow Worms are actually increasing
at Clipstone Old Quarter and if you look at the two site
maps produced above, you could quite easily reach the
same conclusion. The above left distribution map is from 2010 (the 2009 map is virtually identical), with 2013 shown on the right. At a glance then yes, there would seem to be clear evidence of Glow Worms having spread north-eastwards. This is especially noticable in sections E and S, to the top right of both maps. In reality, it is not really representative of any outward range increase in the past few years, it just shows the colony limits, long established over many years. From 2009-2011, we covered sections S and E very little, believing Glow Worms were not present along these sections. Range spread is still confined to within the overall 'colony' boundaries achieved over the years and is restricted to what distance hunting larvae walk during their two year life. Obvious spread along certain sections is due to larval movements over a number of years, but the colony still remains confined. |
||
| ... | ||
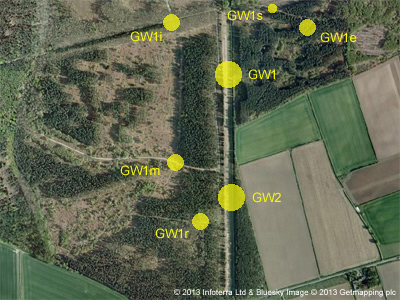
| Across the Sherwood
Forest NNR area, Glow Worms are restricted to a handful
of relict populations, remaining as small (just a handful
of females), well spaced colonies. There is a general arc
of Glow Worm colonies which stretch across the NNR from
Clipstone Old Quarter near Edwinstowe, to Sherwood Heath
SSSI lying west of Ollerton. There is no reason to suggest that Glow Worms have always been so confined in this area and we have record based evidence which confirms a recent decline in colonies and numbers. In 2013, the Sherwood Forest Country Park and suitable sites in the immediate area were surveyed throughout the Summer. The right hand map breaks the Clipstone Old Quarter colony down, effectively showing that there are two main colonies (GW1 and GW2) then five smaller colonies centred at GW1e, GW1i, GW1r, GW1m and GW1s. Over a number of years, larval movement through hunting (the only means of Glow Worm movement and possible colonisation) allows these colonies to merge, to give the appearance of one large, healthy colony. |
 |
|
| ... | ||
| Since 2009,
no evening survey has been missed during the female
glowing season. This includes periods of one-two weeks
before and after the first or last females have been
recorded. Despite such consistant coverage, it has been
(and was in 2013) possible to walk several sections for
weeks and not record a single female. As examples, the
site was surveyed a total of 72 times this year, yet
section S produced Glow Worms on just two dates, section
P produced just one female and sections F and G managed
just four females all season. This shows that smaller Glow Worm colonies can be easily missed without consistant surveying. Even section D, which is without doubt the most productive section each year, it is possible to survey four or five nights in peak season and yet still not record a single female. So the discovery of good numbers of Glow Worms at the top of section E in 2012, was not evidence of real range expansion at all. It was perhaps representative of a good year, but Glow Worms had actually been there all along and it was just that we had missed them previously. |
||
| ... | ||
| Early Spring larval survey results and 2013 data | ||||||||||||||||||||||||||||||||||||||||||||||||||||||||||||||||||||||||||||||||||||||||||||||||||||||||||||||||||
| ... | ||||||||||||||||||||||||||||||||||||||||||||||||||||||||||||||||||||||||||||||||||||||||||||||||||||||||||||||||||
| The real factor
influencing the whole of the glowing season was the late
Spring. Larval activity along sections A, B, C and D
began as late as the second week of April, yet ended more
or less on time around the third week of May. A total of 103 larvae were found during our late afternoon or early evening surveys, which was considerably more than in 2012, Yet the final total of females in 2013 was 100 lower than in 2012. Overall, Glow Worm larvae recorded this Spring, were 1.1cm smaller than an average attained over the Spring period 2009-2013, but notice how small post-hibernation larvae were in week April 8-14th. |
|
|||||||||||||||||||||||||||||||||||||||||||||||||||||||||||||||||||||||||||||||||||||||||||||||||||||||||||||||||
| ... | ||||||||||||||||||||||||||||||||||||||||||||||||||||||||||||||||||||||||||||||||||||||||||||||||||||||||||||||||||
| Nocturnal larval surveying We also surveyed for larvae after dark on mild evenings from January through to the first females appeared in June. A more detailed account will be published later this year, but we thought that there should at least be some mention of our findings at this point. Much remains unknown about larval bioluminescence. The general theory (not ours) is based along the lines that larvae produce regular glows as a warning of their distastefulness to predators. If this were the case, then surely larvae would glow on all nights they were active? |
||||||||||||||||||||||||||||||||||||||||||||||||||||||||||||||||||||||||||||||||||||||||||||||||||||||||||||||||||
| ... | ||
 |
We
commenced a long-term research project on this subject
last Autumn, observing larvae in the wild and 11 larvae
kept from late August 2012 - June 2013 in captivity. The first results showed that larvae generally stopped glowing around the middle of September and the Autumn Equinox. This applied to both wild and captive larvae. |
|
| ... | ||
| Wondering if larval bioluminescence might
recommence again around the time of the Spring Equinox,
was one question to try and answer in Spring 2013, So a
series of evening site visits began in the first week of
January, taking place on evenings/nights when the
temperature was mild enough for larval activity. No bioluminsecence was observed from either wild or captive larvae, until a short period of larval bioluminescence was noted on four dates between May 10th and 21st, which would effectively be from fully fed, pre-pupating larvae. It was an interesting discovery, made all the more interesting because all the bioluminsecence recorded was of long duration, which could last several minutes. Similar (but limited) long duration bioluminsecence was also observed from some of the captive larvae around the same time. One larva was found glowing on the edge of the track along section J on May 10th and was clearly in the early stages of pupation. It pupated on May 16th before emerging on May 27th. On May 30th, a bright glow was found to be from a freshly formed (still cream coloured) female pupa. This pupa was marked, left on site and monitored every other evening, but was found dead two or three days before expected emergence. It is believed to have been predated by other invertebrates. We also wanted to try and clarify larval growth rates more. Six larvae in the 15-18mm size ranges, were taken into captivity, but kept outdoors. All pupated to produce males, well before any females emerged in the wild. Regular bioluminsecence from wild larvae finally resumed from June 21st onwards and continued throughout the glowing season. |
||
| ... | ||
| Female
Glow Worm survey results and 2013 data in detail We mentioned earlier in this summary, that the overall population trend at Clipstone Old Quarter is down. Down by 300 females since 2011 and 100 on 2012 totals. The table below, shows the survey section counts of female Glow Worms for each year since 2010. The figure after the forward slash, represents the combined total of females for that year. The percentages perhaps represent the most important figures of all, showing any increase or decrease within the Glow Worm population by using the data from 2010 as a baseline. From 2011, we have showed the changes and trends in the female Glow Worm population using the following single letter codes. |
||
| .... | ||
| I = Population increased .. S = Population stable .. and .. D = Population declined .. tGW = Total females recorded during the year | ||
| .... | ||
| Table 01. ... Female Glow Worm counts per survey section 2010-2013 | ||
| .... |
| .. | 2010 .. tGW = 502 | .. | 2011.. tGW = 792 | .. | 2012.. tGW = 599 | .. | 2013.. tGW = 495 | |||||
| Section | .. | Count/Total | Percentage | .. | Count/Total | Percentage | .. | Count/Total | Percentage | .. | Count/Total | Percentage |
| A | .. | 017/502 | 03.38% | .. | 032/792 | 04.04%0I | .. | 036/599 | 06.01%0I | .. | 013/495 | 02.62%0D |
| B | .. | 034/502 | 06.77% | .. | 046/792 | 05.80%0S | .. | 041/599 | 06.84%0S | .. | 033/495 | 06.66%0S |
| C | .. | 019/502 | 03.78% | .. | 019/792 | 02.39%0D | .. | 029/599 | 04.84%0I | .. | 027/495 | 05.45%0I |
| D | .. | 095/502 | 18.92% | .. | 212/792 | 26.76%0I | .. | 157/599 | 26.21%0S | .. | 139/495 | 28.00%0I |
| E | .. | 000/502 | 00.00% | .. | 019/792 | 02.39%0I | .. | 053/599 | 08.84%0I | .. | 023/495 | 04.64%0S |
| F | .. | 023/502 | 04.58% | .. | 030/792 | 03.78%0D | .. | 011/599 | 01.83%0D | .. | 003/495 | 00.60%0D |
| G | .. | 010/502 | 01.99% | .. | 023/792 | 02.90%0I | .. | 024/599 | 04.00%0S | .. | 001/495 | 00.20%0D |
| H | .. | 001/502 | 00.19% | .. | 003/792 | 00.37%0S | .. | 009/599 | 01.50%0I | .. | 003/495 | 00.60%0S |
| I | .. | 016/502 | 03.18% | .. | 047/792 | 05.93%0I | .. | 052/599 | 08.68%0I | .. | 012/495 | 02.42%0D |
| J | .. | 107/502 | 21.31% | .. | 110/792 | 13.88%0D | .. | 046/599 | 07.67%0D | .. | 103/495 | 20.80%0I |
| K | .. | 035/502 | 06.97% | .. | 046/792 | 05.80%0D | .. | 005/599 | 00.83%0D | .. | 026/495 | 05.25%0S |
| L | .. | 037/502 | 07.37% | .. | 015/792 | 01.89%0D | .. | 003/599 | 00.50%0D | .. | 016/495 | 03.23%0D |
| M | .. | 022/502 | 04.38% | .. | 046/792 | 05.80%0I | .. | 032/599 | 05.34%0S | .. | 011/495 | 02.22%0D |
| N | .. | 033/502 | 06.57% | .. | 059/792 | 07.44%0I | .. | 040/599 | 06.67%0S | .. | 030/495 | 06.06%0S |
| O | .. | 045/502 | 08.96% | .. | 059/792 | 07.44%0D | .. | 044/599 | 07.34%0S | .. | 037/495 | 07.47%0S |
| P | .. | 006/502 | 01.19% | .. | 003/792 | 00.37%0D | .. | 016/599 | 02.67%0I | .. | 001/495 | 00.20%0D |
| R | .. | 004/502 | 00.79% | .. | 022/792 | 02.77%0I | .. | 012/599 | 02.00%0S | .. | 015/495 | 03.03%0I |
| S | .. | 000/502 | 00.00% | .. | 000/792 | 00.00%0- | .. | 015/599 | 02.50%0I | .. | 002/495 | 00.40%0D |
| .... | ||
| Despite the cold March holding up larval
development, we commenced surveying for the first females
on May 20th, with the first of 495 females (F001 and
F002) finally appearing on June 8th, in sections M and C
of the survey site. After a stuttering start with very
low numbers, a general increase of emerging females was
noted from July 2nd, before a sudden emergence occurred
on July 5th. Over a five day period from July 5th and
9th, 210 females (42.42% of this year's total) emerged,
to produce the most extreme peak in numbers we have
recorded to date. The 2013 graph below, is certainly extremely different to the years preceding it. There is only the merest evidence of an early peak in numbers we typically get here before a main (lower) later peak, but you do have to look very hard to find it. The general increase in numbers was considerably later than in previous years, but was obviously indicative of the late Spring. |
||
| .... |
 |
||
 |
||
 |
||
 |
||
 |
| .... | |||||||||||||||||||||||||||||||||||||
| Unusually,
the first adults of the season were actually all males,
with the first occurring on May 28th, when located
visually on low foliage after observing two faint but
distinct flashes. This record was then followed by two
males on June 6th, before another was found on June 8th. One of the seasons interesting aspects, turned out to be the unusually high number of males present throughout the season. |
|
||||||||||||||||||||||||||||||||||||
| .... | |||||||||||||||||||||||||||||||||||||
|
The number of males can be gauged by the
number of 'one night' females over the course of the
season. Table 02 shows the peak dates and percentages of
one night females recorded between 2009 and 2013. The peak numbers of one night females in 2013, was lower than all other years, though relatively similar to those recorded in both 2009 and 2012. What is more remarkable, is the variation in percentage range found throughout the course of the season - just 40-68% in 2013, compared to ranges of between 12-70% in 2012 and 17-92% in 2011. Even the last few females were still likely to be mated and our survey evidence showed that probably as few as three females actually remained unmated this year. The figure of 55.5% for females 451-495 is high. Tables 03 to 03d are produced to allow the reader to make comparisons between previous years. |
|||||||||||||||||||||||||||||||||||||||||||||||||||||||||||||||||||||||||||||||
|
Even though this year the
season was very late and then turned out to be very
short, it was probably the most interesting for us
personally to study, as it was so very different to any
glowing season preceding it. It was quite impossible to actually predict any event such as an early peak in female numbers, then a main (average) peak. Although at the time of surveying, we could not make out the early peak in numbers we have recorded before, it was still there but only just. The main peak turned out to be exactly that, but on a much greater scale than we have become used to. Peak numbers occurred between July 5th and July 9th. Highest female counts and respective numbers of emergent females, consisted of 78 (57 new) on July 5th, 81 (45 new) on July 6th, a site record of 90 (52 new) on July 7th and 81 (42 new) on July 9th. As we have already mentioned, 42.42% of all females emerged during this period. |
|||||||||||||||||||||||||||||||||||||||||||||||||||||||||||||||||||||||||||||||
|
|
|||||||||||||||||||||||||||||||||||||||||||||||||||||||||||||||||||||||||||||||
|
One aspect of female
glowing behaviour we have yet to try and find an answer
to, is their sometimes unpredictable nature of
appearance. Even on nights which seem perfectly ideal for
activity, some females fail to appear. Its something we
have noted every year since our studies began in 2009. Where females are in grass, such as sections A, B, C and D, quite often every single female does not glow. Work needs to be done on this, but it is likely to be a combination of lower ground-level temperature and higher moisture/humidity levels, as females glowing along the sides of forest tracks are always less affected. We have found that the glowing habits of individual females, can show huge variation. Some will glow every night (rarely failing to appear) and yet others almost come and go. We have been able to rule out glowing females being obscured by vegetation, logs or other object, as all are generally easy to find when marked and very rarely move any distance between nights. |
|||||||||||||||||||||||||||||||||||||||||||||||||||||||||||||||||||||||||||||||
|
Unpredictability in
female bioluminscence can be caused by an unsuccessful
mating. During the season, we recorded females F031,
F072, F233 and F407 with males, but mating was obviously
unsuccessful and each female resumed glowing again either
the next, or several nights later. Unsuccessful mating seems to largely be the female's fault and from what we have observed, usually concerns females situated in grass. The grass in survey sections A, B, C and D is cut late each year. Over time, a thatch of cut grass builds up and forms a layer around ground level. Once females have attracted a male, the female will begin her descent from her glowing location and will often go under the build up of thatch, where it is thought mating takes place. Sometimes the male must be forced off the female, when she goes one way and he simply cannot maintain hold and loses the female. |
|||||||||||||||||||||||||||||||||||||||||||||||||||||||||||||||||||||||||||||||
| .... | ||
Females have often been recorded as being 'absent' for several nights. The longest period of absence we have recorded is eight and nine nights, which was shown by two females in 2012 and both of which resumed glowing at their exact previous location. One or two nights when a female is not recorded glowing is more typical and is often temperature related, especially if it is cool. Females rarely glow when the temperature is 8°C or below. In 2013, the following five females all stopped glowing for four or more continuous days/nights, then resumed glowing later. No males were visibly recorded with these females, but it is likely that some may have attracted males, but mating was not accomplished. The figures in brackets after the female number, refers to nights glowing (shown as on) and nights absent (shown as off). To clarify and use as an example, F050 glowed for 4 nights, failed to glow for 3 nights, glowed for 2 nights, failed to glow for 6 nights, then glowed for 1 night. F050 (4 on, 3 off, 2 on, 6 off, 1 on); ...F187 (2 on, 4 off, 8 on); ... F207 (3 on, 5 off, 1 on); ... F340 (1 on, 4 off, 1 on); ... F457 (1 on, 5 off, 1 on) In 2012, the following females were recorded as being absent for more than four or more continuous nights. It is interesting to note that during this year, it was only the early and late emerging females that showed this unpredictable glowing. F007 (1 on, 8 off, 5 on); ... F008 (1 on, 2 off, 1 on, 4 off, 1 on, 1 off, 6 on); ... F012 (1 on, 1 off, 1 on, 5 off, 2 on); ... F015 (1 on, 6 off, 1 on); ... F020 (2 on, 1 off, 1 on, 5 off, 1 on); ... F028 (1 on, 6 off, 1 on); ... F029 (1 on, 4 off, 1 on, 1 off, 1 on); ... F030 (1 on, 4 off, 2 on); ... F060 (1 on, 2 off, 2 on, 4 off, 2 on); ... F352 (1 on, 9 off, 1 on); ... F415 (1 on, 5 off, 2 on, 1 off, 2 on); ... F433 (1 on, 4 off, 1 on, 3 off, 1 on) |
||
| .... | ||
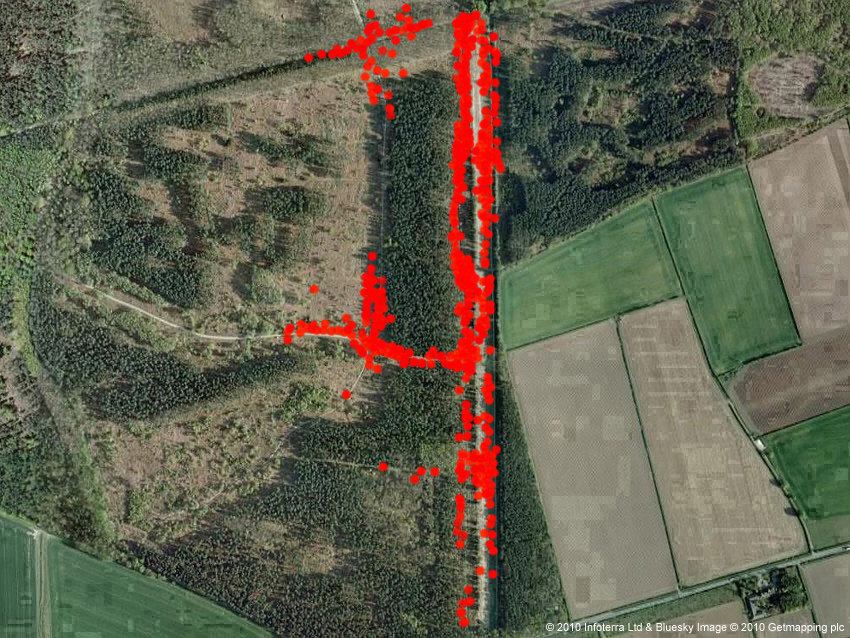
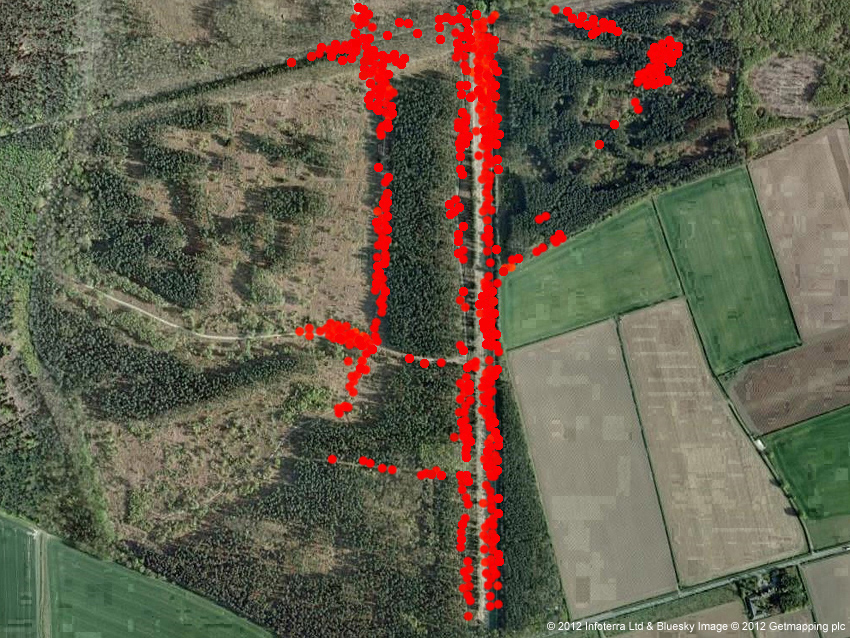
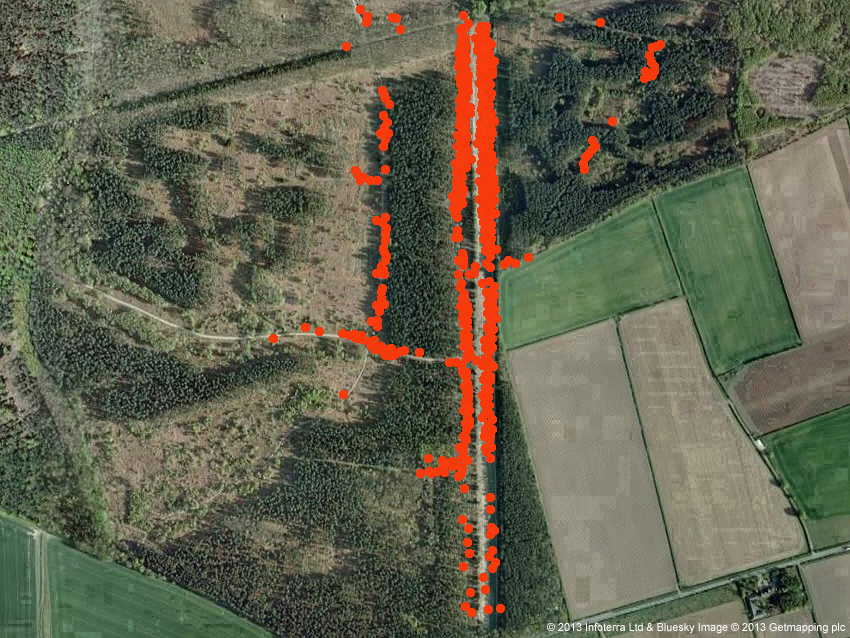
| Below:- Arial map showing the positions of female Glow Worms at Clipstone Old Quarter during 2013. | ||
| .... | ||
 |
||
| .... | ||
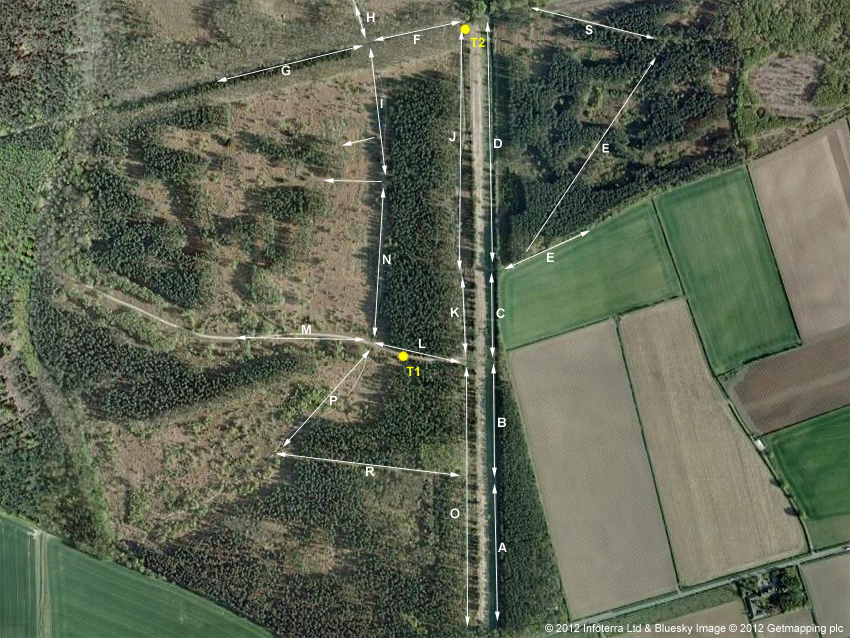
| Below:- Arial map showing the survey route we take each night. Sections A, B, C and D are the only areas where larval counts are made. The two yellow dots show the two locations (highest and lowest points on site) where the temperature is taken during the season. | ||
| .... | ||
 |
||
| .... | ||
| Weekly
female counts in survey sections A - S from 2010 - 2013 We divide Clipstone Old Quarter into 18 different survey sections, recording the emergence of individual females within each section and noting the date on which they appear. Adding up the weekly totals for all the areas, we then produce the results in graph form each year. As the available data builds over time, these graphs should start to show differing trends from across the survey site. Read the graphs for each section from left-right and top-bottom. |
||
| .... |
| Section
A Grass (sunny, flat aspect) |
|||
 |
 |
||
 |
 |
||
| Section
B Grass (sunny, north-facing) |
|||
 |
 |
||
 |
 |
||
| Section
C Grass (sunny, south-facing) |
|||
 |
 |
||
 |
 |
||
| Section
D Grass (sunny, south-facing) |
|||
 |
 |
||
 |
 |
||
| Section
E Forest path (woodland/field edge). |
|||
 |
 |
||
 |
 |
||
| Section
F.Forest
track (dense shade) |
|||
 |
 |
||
 |
 |
||
| Section
G.Forest
track (dense shade). |
|||
 |
 |
||
 |
 |
||
| Section
H Forest
track (partial shade) |
|||
 |
 |
||
 |
 |
||
| Section
I Minor forest path (enclosed sunny
habitat) |
|||
 |
 |
||
 |
 |
||
| Section
J Forest track (enclosed habitat,
south facing) |
|||
 |
 |
||
 |
 |
||
| Section
K.Forest
track (south facing) |
|||
 |
 |
||
 |
 |
||
| Section L.Forest track (flat aspect). | |||
 |
 |
||
 |
 |
||
| Section
M Forest
track (flat with open aspect) |
|||
 |
 |
||
 |
 |
||
| Section
N Minor forest path (south-facing) |
|||
 |
 |
||
 |
 |
||
| Section
O Forest track (enclosed, generally
north-facing) |
|||
 |
 |
||
 |
 |
||
| Section
P Forest track (north-facing). |
|||
 |
 |
||
 |
 |
||
| Section
R Overgrown
grass path (dense shade and flat) |
|||
 |
 |
||
 |
 |
||
| Section
S Forest
track/path (mostly open and flat, but large section
within Pines and shade) ... |
|||
 |
 |
||
 |
 |
||
| ... | |||
| There are
continuing downward trends in A, F, G, I, L, M, P and S
of the 18 survey sections. The populations in sections B,
E, H, K, N and O remain stable, but populations are
increasing in sections C, D, J and R. Looking though the
above graphs reveals just how late this season was. In some sections (notably sections I, L and M) the season was also especially short this year. Glow Worms 2013 - a final overview and look ahead to 2014 2013 was not only remarkable for its late and shortness of glowing season, but especially the unusually high and prolonged peak in numbers. We finally managed to achieve a direct comparison between the Glow Worm season at Clipstone Old Quarter, with another site on the Great Orme at Llandudno in Wales, thanks to the tireless recording and data collection by Jenni Cox. We have not touched on this two site comparison in the main summary above, but for now have produced two graphs showing the female counts at both sites during 2013 below. They may look different, but there are several similarities, so we will be producing a more detailed report on this later in the year. |
|||
 |
|||
 |
|||
| The Dukeries
Car Rally held in early June, once again gave us cause
for concern, not just for the site's Glow Worm
population, but invertebrates in general. Now knowing
considerably more about larval hunting range and pupation
sites, means we can prove that many are lost through the
timing of this event. While not against the event at all,
we are against the rally being held in Spring and through
a SSSI. The proposed thinning/felling operations at Clistone Old Quarter have still to be undertaken, but is cause for concern. It will affect the numbers of larvae in certain sections, so we are expecting another drop in the numbers of female Glow Worms next year. The very dry Summer in 2013, will hopefully give way to a wetter Autumn to help improve the larval survival rate. Dilys and myself would like to thank Martin Dale, for his continuous enthusiasm throughout yet another glowing season and to the other interested members of the public who sometimes tagged along with us. We also wish to thank the staff of the Sherwood Forest visitor centre, who guided two public Glow Worm walks to meet us on site, for what were two very enjoyable evenings. Once again, the Glow Worm provided a bit of magic for the children and hopfully installed a future interest in Natural History ..... something that many (much rarer species) often fail to do. |
|||