
| Nottinghamshire Glow Worms 2023 |
| ..... |
|
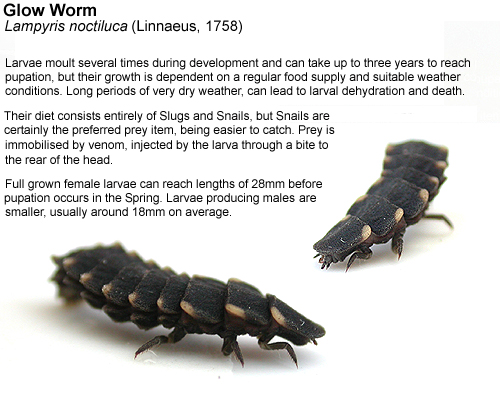
The Glow Worm is
without doubt, one of our most fascinating insects. Famous for the ability to produce its own light,
the green bioluminescence emitted by the female Glow
Worm has formed the basis of countless fairy tales and
folklore over centuries.
Although still regarded by some authorities as being both nationally and locally common, this delightful beetle has been proved to be in serious decline in Nottinghamshire. The data collected by a number of recorders over the past ten years, has helped confirm both a decline and a demise in Nottinghamshire's Glow Worm populations. However, getting people to sit up and take notice has proved to be rather difficult and it doesn't help when those very same authorities continue to denounce any existance of decline. Habitat loss through urbanisation and industrial development, the use of pesticides and herbicides in modern farming practices and the increase in light pollution, are all thought to have contributed to the Glow Worm's decline. |
 |
|
| ... | ||
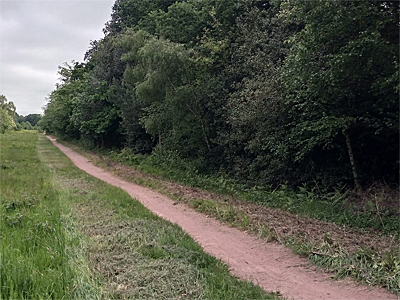
| But Nottinghamshire is fortunate in having one of the UK's largest and most famous Glow Worm colonies in the shape of Clipstone Old Quarter. For many years, Clipstone Old Quarter (located within the heart of Sherwood Forest) was synonymous for almost producing large Glow Worm numbers over a season, but quite often the UK's earliest records of both larvae and females. And as we enter yet another year, there is much to look forward to, despite a recent fall in Glow Worm numbers. | ||
|
Help monitor Glow Worm
distribution - contribute your records Useful Glow Worm links on www.eakringbirds.com
|
 |
|
| ... | ||
| Predicting the start of the
2023 season I still occasionally get asked to predict the date when the first Glow Worm will appear at Clipstone Old Quarter each year? It's a difficult question to answer with any degree of accuracy, although people expect it to be easy after monitoring this famous Glow Worm colony for well over a decade. Such predictions are difficult and will always be largely guesswork at best, as there are a number of factors needed to be taken into account and they vary from year to year. Temperature over preceding months, or over the previous year is certainly one and unsympathetic habitat management, or the success of larvae finding food are others. |
||
| ... | ||
 |
Periods of prolonged snow, ice or heavy rain, drought and high temperatures are other factors which can affect larval and pupal development. The hot, dry summer of 2022 may well prove to have had serious implications on many Glow Worm populations across much of the UK and so counts at some sites affected by the dry conditions may well be down on recent years. In Nottinghamshire, those Glow Worm colonies situated on areas of heathland will likely be the most affected, although this remains to be seen. The Sherwood Forest area has undergone periods of very dry conditions in previous years, which, if they continued for any length of time, were showed through observations to lead to the dehydration of a large number of larvae. During larval surveying in the late Summer and early Autumn of 2013 (another very dry Summer) Dilys and I found some larvae were becoming paper thin through dehydration and when rain eventually arrived on September 6th, we recorded larvae taking on much needed water. The summer of 2022 though, was on another level in comparison to what I have personally witnessed at Sherwood Forest previously. The variabilities of the UK weather is without doubt the biggest factor in determining when any species will appear, but it's not just the weather or conditions around the time of adult emergence, but over the course of the previous few months and probably well over the past year that needs to be borne in mind. |
|
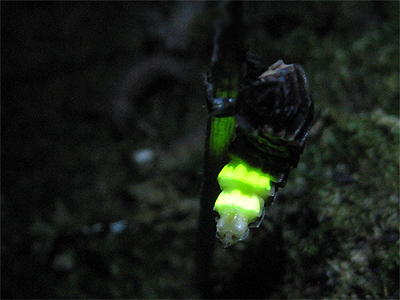
| Photograph by Martin Dale | ||
For larvae going on to become adult this Spring and Summer, it is necessary for those larvae to have had suitable conditions for hunting and to have managed to find enough food over the previous Summer and Autumn and that is probably be more critical than the immediate Spring period. We always thought that most pre-pupation development took place place prior to over-wintering and in captivity, we certainly had over-wintering larvae never eat anything before pupation. |
| Average minimum Winter temperatures 2008-2023 | ||||||||||||||||
| ...... | ||||||||||||||||
| 2008/09 | 2009/10 | 2010/11 | 2011/12 | 2012/13 | 2013/14 | 2014/15 | 2015/16 | 2016/17 | 2017/18 | 2018/19 | 2019/20 | 2020/21 | 2021/22 | 2022/23 | ||
| Nov - Apr | 2.80°C | 2.08°C | 2.35°C | 3.28°C | 1.55°C | 3.33°C | 2.93°C | 3.59°C | 3.46°C | 2.68°C | 2.97°C | 3.50°C | 2.55°C | 3.61°C | 3.63°C | |
| Jan - Apr | 2.80°C | 1.62°C | 3.67°C | 2.75°C | 1.05°C | 3.62°C | 2.45°C | 2.35°C | 3.50°C | 2.47°C | 3.41°C | 3.82°C | 1.92°C | 3.40°C | 3.55°C | |
| ...... | ||||||||||||||||
| Date of first female | May 27th | May 24th | May 13th | May 30th | June 8th | May 18th | May 23rd | June 3rd | May 20th | May 24th | May 31st | May 20th | June 3rd | May 17th | May 27th | |
| .................. | ||||||||||||||||
| Average maximum Winter temperatures 2008-2023 | ||||||||||||||||
| ...... | ||||||||||||||||
| 2008/09 | 2009/10 | 2010/11 | 2011/12 | 2012/13 | 2013/14 | 2014/15 | 2015/16 | 2016/17 | 2017/18 | 2018/19 | 2019/20 | 2020/21 | 2021/22 | 2022/23 | ||
| Nov - Apr | 8.68°C | 8.04°C | 8.71°C | 9.79°C | 7.33°C | 10.29°C | 9.50°C | 10.26°C | 9.60°C | 8.51°C | 10.51°C | 10.31°C | 8.91°C | 10.41°C | 9.76°C | |
| Jan - Apr | 9.27°C | 7.67°C | 10.70°C | 9.75°C | 6.95°C | 10.89°C | 9.60°C | 9.30°C | 10.12°C | 8.57°C | 10.85°C | 11.30°C | 8.80°C | 10.90°C | 10.25°C | |
| ...... | ||||||||||||||||
| Date of first female | May 27th | May 24th | May 13th | May 30th | June 8th | May 18th | May 23rd | June 3rd | May 20th | May 24th | May 31st | May 20th | June 3rd | May 17th | May 27th | |
| .................. | ||
| Glow Worms under threat
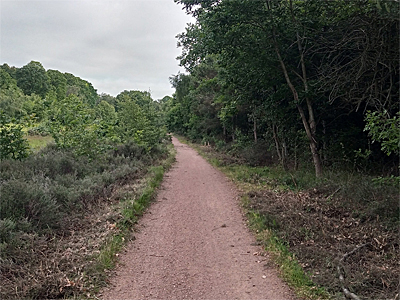
again at Clipstone Old Quarter as mowing undertaken On the evening of June 1st, I visited Clipstone Old Quarter to survey for Glow Worms after recording four glowing females the previous evening during a visit to the site. However, this visit wasn't to end well and if I'm being honest, I might not be back to record Glow Worms there again. As I rounded the Centre Tree to make my way down the grass strip sections of D, C, B and A, I was shocked to see that either side of the Sustrans path/cycle route, had been flail mowed using a tractor-pulled unit. Interest in recording any other Glow Worms was quickly gone, as I realised that the mowing continued, ultimately finding that up to 6-8ft either side of the shale path had been flailed. The worst affected side was the eastern-side of the path, where all growing vegetation had been cut to ground level in places and up to the Hollys along the length of the four survey sections. This action also took out developing nectar-bearing flowers (the best section here for flora) scrub, bramble and Honeysuckle known to have had eggs of the Broad-bordered Hawk-moth on and which of course are now lost. |
 |
|
|
Once again, a site within the Sherwood Forest NNR and part
of one of the two SSSI's making up that NNR, has suffered at the
hands of wildly indescriminate, disgraceful management practice.
I immediately sent a text to Forestry England, who replied promptly first thing the next morning, saying they had no idea who was responsible. An email was sent to the Sherwood Forest Trust, who came back with the reply that it was 'very odd and disappointing', but they knew nothing of any proposed work. But this has never happened before, at least nothing else other than the annual cut the grass strip used to get each year until around five or six years ago. But that was always done at the correct time of year to cause minimal disturbance to the site's Glow Worms and other wildlife, between September and March each year and not late May/early June. I returned to Clipstone Old Quarter early the next morning and noted that the mowing continued (or originated from) the Sustrans path running north from the Centre Tree towards the RSPB's reserve at Budby South Forest at it's junction with the Sherwood Forest CP. A later walk to Budby South Forest from Budby Pumping Station, showed that the northerly access track around the reserve had also been cut similarly. |
 |
|
| I am intent on finding out who's responsible for this mowing and will be reporting it to Natural England. Once again, it goes to prove that some managers, or their workers cannot be trusted and that there is no respect or consideration given towards wildlife here. I suspect that maybe this will be a case of 'friends covering up for friends' and we'll never find out who is responsible. But I have a very good idea of who's done this. | ||
| Nottinghamshire Glow Worm
Survey records 2023 Larval surveys recorded the first larvae of 2023, with two on the path in Sections C and D on March 20th, but there was very little coverage after this date. The first female was recorded on May 27th and resulting counts from all sites producing records have been poor (as of July 12th). Please note that there may be delays in updating this section during the glowing season. Contributors to the Nottinghamshire Glow Worm Survey:- Iain Au-Yong. Martin Dale. David Daft. Katie Doull. Trish Mather. Johnny Maxwell. Phil Parry. Lynn Preece. Mark Rolfe. Richard Upright. Trevor Pendleton. Claire Watson. Russ Watson. |
| Surveyed | Site name | Grid ref | Site type/habitat | Qty | Notes | Recorder | ||||||
| August 11th | Clipstone Old Quarter | SK608674 | Former Pine plantation and grass/scrub strip | 0 | No female Glow Worms recorded this evening, but a glowing larva was found in Section D. | TP. | ||||||
| August 8th | Clipstone Old Quarter | SK608674 | Former Pine plantation and grass/scrub strip | 1 | One female present in Section D and a larva glowing in Section J. Sections A, B, C, D, F, G, K, J and O were surveyed. | TP. | ||||||
| August 1st | Clipstone Old Quarter | SK608674 | Former Pine plantation and grass/scrub strip | 8 | A very surprising count of eight females (the largest ever August count anywhere in Nottinghamshire) recorded this evening, with two females in Section F near the junction with Section I, five in Section D and a single in Section B, where the single glow of a male was also recorded. Sections A, B, C, D, F, K, J, L, M and O were surveyed. This is the first record of Glow Worms anywhere in Nottinghamshire since August 2012. | TP. | ||||||
| July 13th | Clipstone Old Quarter | SK608674 | Former Pine plantation and grass/scrub strip | 22 | A total count of 22 female Glow Worms recorded this evening, with half of the total coming from the upper part of Section D. Sections A, B, C, D, K, J, L, M and O were surveyed. | TP. | ||||||
| July 12th | Sherwood Heath | SK647675 | Grass and heather heathland | 25 | Another highest count from any Nottinghamshire site (for 2023) and the first record of Glow Worms from this site this year. Sherwood Heath once boasted record counts of over 200 Glow Worms in 2008, but has produced very poor counts in recent years. | KD. LP. | ||||||
| July 3rd | Ruddington | SK562314 | Active railway line, grass banked with lined trackbed | 21 | The highest known count of Glow Worms anywhere in Nottinghamshire so far this year, with an excellent site total of 21 females and a single larvae recorded. | MD. PP. | ||||||
| July 2nd | Clipstone Old Quarter | SK608674 | Former Pine plantation and grass/scrub strip | 3 | Three females recorded across the site this evening. | CW. RW | ||||||
| June 30th | Ransom Wood | SK575594 | Mixed woodland, grassland and scrub | 0 | No Glow Worms recorded. | TP. | ||||||
| June 29h | Blackpool Plantation | SK600669 | Former Pine plantation | 1 | One female. | TP. | ||||||
| June 29th | Clipstone Old Quarter | SK608674 | Former Pine plantation and grass/scrub strip | 3 | Three females recorded. Only sections L, M and O were surveyed. | TP. | ||||||
| June 23rd | Clipstone Old Quarter | SK608674 | Former Pine plantation and grass/scrub strip | 5 | Just five females recorded. | JM. | ||||||
| June 20th | Harlow Wood | SK555565 | Coniferous plantation, with areas of recent clearfell | 11 | 11 females and six males found scattered across the site this evening. There appears to be an increasing problem with light pollution now at the site. | JK. CK. | ||||||
| June 19th | Clipstone Old Quarter | SK608674 | Former Pine plantation and grass/scrub strip | 14 | A total of 14 females, with most in Section J this evening. Sections A, B, C(1), D(1), K(1), J(9), L, M and O(2) were again surveyed, with the number of females per section given in brackets. | TP. | ||||||
| June 16th | Clipstone Forest | SK616601 | Mixed woodland, heathland, grassland and scrub | 6 | Six females from different areas of Sherwood Pines/Clipstone Forest, including three females again from a site discovered in 2018 and which was known to have been on fire a few years ago. Also found were a single larva and eight males, including four to an artificial lure. | MD. IA. MR. | ||||||
| June 15th | Clipstone Old Quarter | SK608674 | Former Pine plantation and grass/scrub strip | 6 | Six females recorded from along Sections I, P and R this evening, with no Glow Worms reported from the usual survey sections of A, B, C, D, K, J, L, M and O. | JM. | ||||||
| June 13th | Harlow Wood | SK555565 | Coniferous plantation, with areas of recent clearfell | 13 | 13 females (seven of which had males in cop) with an additional five males attracted to lure around the site this evening. | JK. CK. | ||||||
| June 13th | Clipstone Old Quarter | SK608674 | Former Pine plantation and grass/scrub strip | 6 | Six females reported this evening, with four close together at the top of Section J and singles in Sections C and O. | TP. | ||||||
| June 8th | Clipstone Old Quarter | SK608674 | Former Pine plantation and grass/scrub strip | 11 | A double-figure count this evening, with 11 females recorded from most of the survey sections. There were single females in Sections B, C, K, L and M, two in Section D and four in Section J. | TP. | ||||||
| June 8th | Harlow Wood | SK555565 | Coniferous plantation, with areas of recent clearfell | 8 | First Glow Worms of 2023 from this site, which is one of the best in Nottinghamshire and regularly producing good counts at peak times. | JK. CK. | ||||||
| June 7th | Clipstone Old Quarter | SK608674 | Former Pine plantation and grass/scrub strip | 6 | A count of six females reported this evening. | JM. RU. | ||||||
| June 5th | Clipstone Old Quarter | SK608674 | Former Pine plantation and grass/scrub strip | 8 | A count of eight females recorded this evening, with some good news in the form of five females found in the middle of the grass strip sections of D, C, and A. | TP. | ||||||
| June 1st | Clipstone Old Quarter | SK608674 | Former Pine plantation and grass/scrub strip | 5 | Five females recorded this evening. | JM. | ||||||
| May 31st | Clipstone Old Quarter | SK608674 | Former Pine plantation and grass/scrub strip | 4 | Four females recorded this evening, with the female again present at the junction of Sections L and K, two new females in Section J and another at the back of Section C, off the grass strip. Sections A, B, C, D, K, J, L, M and O were surveyed. | TP. | ||||||
| May 29th | Clipstone Old Quarter | SK608674 | Former Pine plantation and grass/scrub strip | 1 | Still just the first female present on the corner of Sections L and K this evening. Sections A, B, C, D, K, J, L, M and O were again surveyed. | TP. | ||||||
| May 27th | Clipstone Old Quarter | SK608674 | Former Pine plantation and grass/scrub strip | 1 | The first female Glow Worm found this evening, situated at the junction of Sections L and K. The usual sections of A, B, C, D, K, J, L, M and O were again surveyed. | TP. | ||||||
| May 26th | Clipstone Old Quarter | SK608674 | Former Pine plantation and grass/scrub strip | 0 | No female Glow Worms recorded. Sections A, B, C, D, K, J, L, M and O were surveyed. | TP. | ||||||
| May 25th | Clipstone Old Quarter | SK608674 | Former Pine plantation and grass/scrub strip | 0 | No female Glow Worms recorded. | JM. | ||||||
| May 24th | Vale of Belvoir | SK830374 | Grass roadside verge and disused railway line between SK608674 and SK771350 | 0 | No female Glow Worms recorded. | MD. DD. | ||||||
| May 24th | Clipstone Old Quarter | SK608674 | Former Pine plantation and grass/scrub strip | 0 | No female Glow Worms recorded. Sections A, B, C, D, K, J, L, M and O were surveyed. | TP. | ||||||
| May 23rd | Clipstone Old Quarter | SK608674 | Former Pine plantation and grass/scrub strip | 0 | No female Glow Worms recorded. Sections A, B, C, D, K, J, L, M and O were surveyed. | TP. | ||||||
| May 21st | Clipstone Old Quarter | SK608674 | Former Pine plantation and grass/scrub strip | 0 | No female Glow Worms recorded. Sections A, B, C, D, K, J, L, M and O were surveyed. | TP. | ||||||
| May 20th | Clipstone Old Quarter | SK608674 | Former Pine plantation and grass/scrub strip | 0 | No female Glow Worms recorded. Sections A, B, C, D, K, J, L, M and O were surveyed. | TP. | ||||||
| May 18th | Clipstone Old Quarter | SK608674 | Former Pine plantation and grass/scrub strip | 0 | No female Glow Worms recorded. Sections A, B, C, D, K, J, L, M and O were surveyed. | TP. | ||||||
| May 14th | Clipstone Old Quarter | SK608674 | Former Pine plantation and grass/scrub strip | 0 | No female Glow Worms recorded. Sections A, B, C, D, K, J, L, M and O were surveyed. | TP. | ||||||
| May 6th | Carlton (Southcliffe Road) | SK608412 | Residential garden in urban area | 1? | A report to the NGWS from a private garden in Carlton, probably of a larva if ID is correct, as several bright glows were seen. A request was made for further information, as this is an urban location and the record has to be considered extremely doubtful at this stage. | TM. | ||||||
| April 28th | Clipstone Old Quarter | SK608674 | Former Pine plantation and grass/scrub strip | 1 | A single 20mm larva recorded from Section B of the survey area this evening, despite the cool temperature. | TP. | ||||||
| April 26th | Clipstone Old Quarter | SK608674 | Former Pine plantation and grass/scrub strip | 0 | No larvae recorded | TP. | ||||||
| April 8th | Clipstone Old Quarter | SK608674 | Former Pine plantation and grass/scrub strip | 0 | No larvae recorded | TP. | ||||||
| April 7th | Clipstone Old Quarter | SK608674 | Former Pine plantation and grass/scrub strip | 0 | No larvae recorded | TP. | ||||||
| April 5th | Clipstone Old Quarter | SK608674 | Former Pine plantation and grass/scrub strip | 0 | No larvae recorded | TP. | ||||||
| April 4th | Clipstone Old Quarter | SK608674 | Former Pine plantation and grass/scrub strip | 0 | No larvae recorded | TP. | ||||||
| April 2nd | Clipstone Old Quarter | SK608674 | Former Pine plantation and grass/scrub strip | 0 | No larvae recorded | TP. | ||||||
| April 1st | Clipstone Old Quarter | SK608674 | Former Pine plantation and grass/scrub strip | 0 | No larvae recorded | TP. | ||||||
| March 31st | Clipstone Old Quarter | SK608674 | Former Pine plantation and grass/scrub strip | 0 | No larvae recorded | TP. | ||||||
| March 29th | Clipstone Old Quarter | SK608674 | Former Pine plantation and grass/scrub strip | 0 | No larvae recorded | TP. | ||||||
| March 25th | Clipstone Old Quarter | SK608674 | Former Pine plantation and grass/scrub strip | 2 | Three larvae found this evening, although one was unfortunately found dead. Larval sizes were 15mm and 14mm (dead) in Section D and a 13mm in Section C of the survey area. | TP. | ||||||
| March 24th | Clipstone Old Quarter | SK608674 | Former Pine plantation and grass/scrub strip | 0 | No larvae recorded | TP. | ||||||
| March 23rd | Clipstone Old Quarter | SK608674 | Former Pine plantation and grass/scrub strip | 0 | No larvae recorded | TP. | ||||||
| March 21st | Clipstone Old Quarter | SK608674 | Former Pine plantation and grass/scrub strip | 0 | No larvae recorded | TP. | ||||||
| March 20th | Clipstone Old Quarter | SK608674 | Former Pine plantation and grass/scrub strip | 2 | The first larvae of 2023 recorded from along the usual survey sections, with a 23 mm larva in Section D and a 14mm larva in Section C. | TP. | ||||||
| March 16th | Clipstone Old Quarter | SK608674 | Former Pine plantation and grass/scrub strip | 0 | No larvae recorded | TP. | ||||||
| February 24th | Clipstone Old Quarter | SK608674 | Former Pine plantation and grass/scrub strip | 0 | No larvae recorded | TP. | ||||||
| January 1st | Clipstone Old Quarter | SK608674 | Former Pine plantation and grass/scrub strip | 1 | A 20mm larva found overwintering (but soon became active) underneath several pieces of old bark in Section O of the recording area. | TP. | ||||||
| ........................... | . | .................................................... | . | ................... | . | ............................................. | . | ....... | . | .......................................................................................... | . | .......................... |
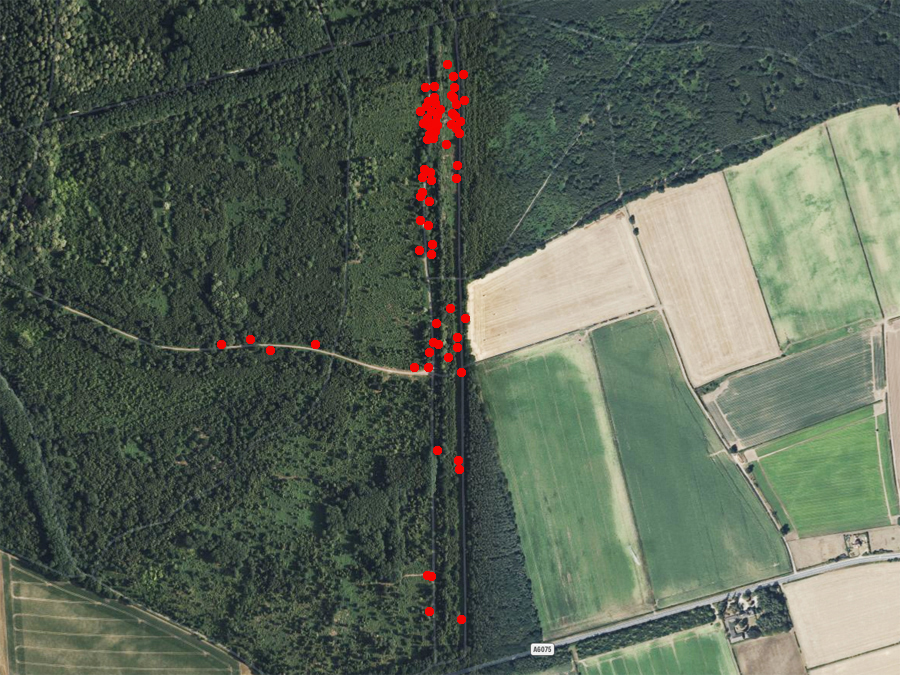
| Female Glow Worm locations at Clipstone Old Quarter 2023 |
| ........................... |
 |
|
Larval survey data
2009-2023 Data gained from larval surveys conducted at Clipstone Old Quarter during March, April and May in previous years, showed a general decrease in the average length of Glow Worm larvae over the time period, but there may be a slight indication of something of an increase since 2021, although this is derived from a much smaller data sample (number of larvae) in both years. We found that the average larval size from 2009 to 2014 was 20.32mm, based on the data gathered from a total of 771 larvae. The data also showed that larvae were on average, considerably larger in 2009 (22.21mm) than in any of the following years, equating to 1.89mm larger than the average produced between 2009 and 2014. This has continued to be the case and the average length of larvae in 2016 was found to be just 17.99mm, showing a decrease of 4.22mm on larval length data obtained in 2009. The data in the table provided in Fig 02 below, is presented as (for example) 17.00mm/tL6. An explanation of this would be 17.00mm (the average larval length) / tL6 (taken from a total of six larvae) but this obviously changes daily after each survey, as the size data for latest weekly time period is continually recalculated and updated. The Spring average follows the same principle, but the average is obviously taken from the total number of larvae found that Spring period. |
| Fig 01. ... Diurnal Glow Worm larval size ranges found during March 2023 | |||||||||||||||||||||||
| .. | |||||||||||||||||||||||
| 9mm-15mm larval size range | Intermediate | 19mm-28mm larval size range | |||||||||||||||||||||
| Section | 9mm | 10mm | 11mm | 12mm | 13mm | 14mm | 15mm | 16mm | 17mm | 18mm | 19mm | 20mm | 21mm | 22mm | 23mm | 24mm | 25mm | 26mm | 27mm | 28mm | |||
| A | .. | 1 | 0 | 0 | 0 | 0 | 0 | 0 | .. | 0 | 0 | 0 | .. | 0 | 0 | 0 | 0 | 0 | 0 | 0 | 0 | 0 | 0 |
| B | .. | 0 | 0 | 0 | 0 | 1 | 0 | 0 | .. | 0 | 0 | 0 | .. | 0 | 0 | 0 | 0 | 0 | 0 | 0 | 0 | 0 | 0 |
| C | .. | 0 | 0 | 0 | 0 | 1 | 0 | 0 | .. | 0 | 0 | 0 | .. | 0 | 0 | 0 | 0 | 0 | 0 | 0 | 0 | 0 | 0 |
| D | .. | 0 | 0 | 0 | 0 | 0 | 1 | 1 | .. | 0 | 0 | 0 | .. | 0 | 0 | 0 | 0 | 1 | 0 | 0 | 0 | 0 | 0 |
| .. | |||||||||||||||||||||||
| 9mm-15mm larval size range 80.00% of total | Intermediate 00.00% of total | 19mm-28mm larval size range 20.00% of total | |||||||||||||||||||||
| Total % | .. | 0.00 | 0.00 | 0.00 | 0.00 | 40.00 | 20.00 | 20.00 | .. | 0.00 | 0.00 | 0.00 | .. | 0.00 | 0.00 | 0.00 | 0.00 | 20.00 | 0.00 | 0.00 | 0.00 | 0.00 | 0.00 |
| Fig 02. ... Glow Worm larval averages during Spring 2009-2023 Data correct as of 01/01/23 * means weekly average data incomplete | |||||||||||||
| .... | |||||||||||||
| Week/period | . | 2009 | 2010 | 2011 | 2012 | 2013 | 2014 | 2015 | 2016 | 2020 | 2021 | 2022 | 2023 |
| March 22-31 | . | ..... | ..... | 18.03mm/tL27 | 21.16mm/tL6. | ..... | 17.90mm/tL13 | . | 18.44mm/tL90 | 17.63mm/tL28 | 00m..............m | 14.00mm/tL3 | |
| April 1-7 | . | 23.33mm/tL3. | 21.27mm/tL13 | 18.64mm/tL70 | 19.00mm/tL5. | .... | 18.65mm/tL24 | 18.16mm/tL6. | 16.46mm/tL13 | 19.75mm/tL4 | 16.75mm/tL4 | . | |
| April 8-14 | . | 21.14mm/tL14 | 19.58mm/tL17 | 19.19mm/tL31 | 19.66mm/tL9. | 17.11mm/tL9. | 18.27mm/tL59 | 19.11mm/tL16 | 15.00mm/tL3 | . | 19.71mm/tL7 | . | |
| April 15-21 | . | 20.45mm/tL10 | 20.78mm/tL18 | 19.78mm/tL53 | 23.20mm/tL5. | 18.34mm/tL34 | 18.62mm/tL22 | 20.66mm/tL8. | 18.26mm/tL20 | 18.00mm/tL1 | . | ||
| April 22-29 | . | 23.32mm/tL25 | 18.74mm/tL53 | 19.97mm/tL39 | 18.77mm/tL9. | 18.61mm/tL25 | 20.20mm/tL36 | . | 18.83mm/tL6* | 21.66mm/tL3 | 21.27mm/tL11 | . | |
| April 30-May 6 | . | 22.95mm/tL20 | 23.20mm/tL5. | 21.87mm/tL8. | 20.95mm/tL22 | 19.85mm/tL16 | 21.87mm/tL21 | . | 17.66mm/tL15 | . | 19.75mm/tL4 | 21.10mm/tL10 | . |
| May 7-14 | . | 22.08mm/tL17 | 23.25mm/tL4. | ..... | 22.30mm/tL10 | 21.62mm/tL21 | 21.25mm/tL4. | ..... | 18.22mm/tL22 | ..... | 19.75mm/tL4 | .21.33mm/tL30 | . |
| May 15-22 | . | . | 19.66mm/tL60 | . | . | 21.71mmtL/8 | . | . | 19.97mm/tL34 | . | . | . | . |
| May 23-30 | . | . | . | . | . | . | . | . | 19.11mm/tL90 | . | .. | . | . |
| . | . | . | |||||||||||
| Spring avg | 22.21mm/tL89 | 20.92mm/tL116 | 19.58mm/tL228 | 20.45mm/tL66 | 19.52mm/tL103 | 19.53mm/tL169 | N/A | 17.99mm/tL83 | N/A | 19.35mm/tL44 | 20.03mm/tL35 | ||
The size data produced since 2010 has been remarkably consistant where sufficient data was collected, showing a variation of just 1.40mm. 2021 and 2022 data is currently not included in this as the data sample is regarded as being too low in comparison to those years. Breaking the data down further, the average size variation in three of the years since (2011, 2013 and 2014) showed variation as little as 0.06mm. If we exclude the 2009 size data on the basis of being unusually large, then an average larval size at this site would be approximately 20.00mm. The relative consistant larval sizes suggests that variations in rainfall and temperature between November and March in any year, actually had no influence on larval size. |
| The Nottinghamshire Glow Worm Survey |
| Beetles |
| Homepage |