| Some notes and observations on the bioluminescence exhibited by the larva of the Glow Worm (Lampyris noctiluca) in captivity |
| ..Project 1: Phase 1. 2012 results |
| .... |
| Please quote the
following when referencing this document Pendleton, T.A.. Pendleton, D.T. and Dale, M.G. "Some notes and observations on the bioluminescence exhibited by the larva of the Glow Worm (Lampyris noctiluca) in captivity" www.eakringbirds.com; December 2012. |
| .... |
| During the course of regular
surveying for adult female Glow Worms Lampyris
noctiluca during the Spring and Summer months, the
shorter glows produced by hunting Glow Worm larvae are
often noticed and recorded appropriately. In August 2012, following the end of another adult glowing season, we decided to engage in two research projects, both of which produced results directly linking the two projects together in several aspects of research. It was anticipated at the outset, that both research projects would probably take several years to complete before enough data had been collected and from which any firm conclusions could be derived. This page details our current findings. |
 |
|
| Project 1: Phase 1. 2012 ... Table of contents | ||
| 1.0 ... Introduction to Project 1: Phase 1. 2012 | ||
| ........ 1.1 ... Captive setups | ||
| ........ 1.2 ... Observing and recording methodology | ||
| .... | ||
| 2.0 ... Larval bioluminescence | ||
| ........ 2.1 ... The bioluminescent rates produced by hunting/active larvae | ||
| ........ 2.2 ... Variations within the duration of larval bioluminescence exhibited by active larvae | ||
| ........ 2.3 ... Detectable patterns in the bioluminescent glows produced by hunting/active larvae | ||
| ........ 2.4 ... The occurrence of long duration bioluminescent glows from captive and wild larvae | ||
| ........ 2.5 ... Extreme periods of bioluminescence exhibited by feeding larvae | ||
| .... | ||
| 3.0 ... Hunting and feeding | ||
| ........ 3.1 ... Conditions conducive to larval activity and bioluminescence | ||
| ........ 3.2 ... Larval bioluminescence during the detection and capture of prey items | ||
| ........ 3.3 ... Larval feeding | ||
| ........ 3.4 ... Recorded larval growth rates during Project 1: Phase 1. 2012 | ||
| ........ 3.5 ... Larval bioluminescence as a direct response to physical interaction | ||
| ........ 3.6 ... Bioluminescent interaction between Glow Worm larvae and other invertebrates | ||
| .... | ||
| 4.0 ... The decline in larval activity prior to over-wintering | ||
| 5.0 ... Project 1: Phase 2. 2013 research work | ||
| 1.0 ... Introduction to Project
1: Phase 1. 2012 Project 1: Phase 1. 2012 was conducted by Trevor and Dilys Pendleton (TDP), based at Market Warsop, Nottinghamshire and Martin Dale (MD), based at Mapperley in Nottingham. The primary aims of this research were to try and determine the following aspects of bioluminescent activity in larvae of the Glow Worm Lampyris noctiluca.
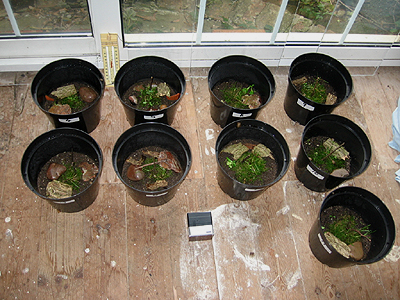
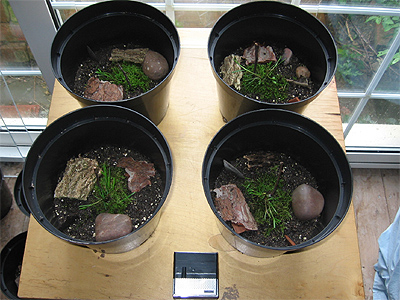
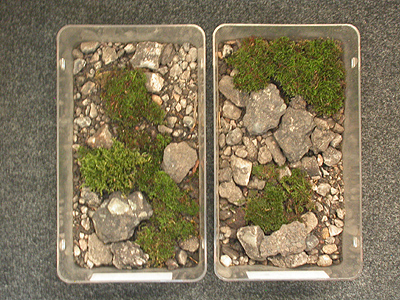
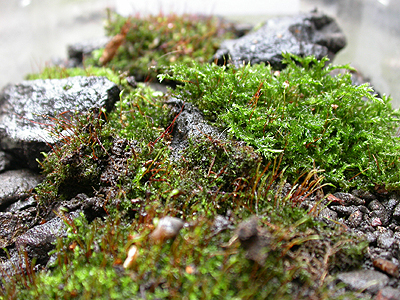
At the start of each research project, we were unaware of any similar research projects, either in progress, or already completed and the results published. The different aspects of each project were something which we had wanted to discover for ourselves, hopefully providing some answers to many questions we had asked during the previous years spent surveying adults at a well known Sherwood Forest Glow Worm colony. The two projects were to look into the number and frequency of bioluminescent glows produced by captive Glow Worm larvae on a nightly basis (Project 1: Phase 1. 2012) and to determine the size ratios of larvae in the wild during late Summer and Autumn (Project 2: Phase 1. 2012). 1.1 ... Captive setups 11 larvae were collected from two Glow Worm colonies near Edwinstowe in Nottinghamshire, during late August 2012. The larvae were of varying sizes, with the smallest measuring 9mm and the largest being 23mm. All larvae were separated, numbered from L1-L11 and housed in large plastic containers of two types, either containing a sand/soil mix or stone substrate with a naturalised layout to provide daytime shelter etc. All 11 larvae were kept indoors, in an unheated room and near a natural light source. The use of artificial lights was prohibited during the research period and all setups were exposed to the sun at some part of the day. Throughout the period, only dull red illumination was used to avoid disturbing the larvae and depleting the observers dark adapted vision. Water or moisture was provided by occasional spraying when the used substrate dried out and spraying was restricted to during the day when required. The two basic setups are shown in the following three photographs below. The top two photographs show the typical setup devised by MD for his nine larvae. The setups were covered with perspex sheeting during the day, which was removed when in full sun. The 230mm pots contained approximately 40mm of coarse gravel for drainage and 40mm of sandy soil substrate, filling the pots to approximately half full. In order to simulate a natural habitat, stones, loose bark, moss and grass were added to each pot, together with a stick offering a permanent structure to observe any climbing behaviour. |
| .... |
 |
 |
|||
| .... | ||||
| With too much
cover, MD noted that larval behaviour was difficult to
observe with some hunting and feeding taking place out of
sight. So a 50/50 cover ratio was sought, together with
some stones and sticks to give the larvae opportunities
to chose elevated areas if they wished. MD considered
that the comparitive confinement of the plant pot
containers, undoubtedly affected larval hunting
behaviour, exhibited by the larvae frequently circling
the pot wall. Attempts were made to break up this
behaviour with vertical pieces of pot or slate, to create
a barrier to persuade the larva to hunt the inner areas
of their habitat. However, they frequently just climbed
over the barrier and commenced circling the container
wall on the other side of the obstacle. Another behavioural pattern noted from some of MD's larvae, was the distinct preference for hunting just along one section of the pot wall. This was observed as a 180° circling of the container, before turning round and retracing the same track back until reaching it's original start point, then turning back once again. Why some did this is not clear, though it could possibly have been due to sunlight illumination during the day, warming only one side of the pot. The same problem was not believed to have been evident in the hunting movements of L1 and L2, which were housed in rectangular containers with TDP. The lower right hand photograph shows the stone substrate setups TDP used for L1 and L2. |
||||
| .... | ||||
| 1.2 ... Observing and recording
methodology The methodology used for recording the data obtained during the observation periods was a simple process. We (TDP) were fortunate to be able to have one person watching larvae 1 and 2, then relaying the duration of bioluminescent glows produced by each larva to the other person, who acted solely as the recorder, noting the times, length of glows and recording the information on paper. Because of our involvement with Project 2, it was decided that we would monitor just two captive larvae, leaving MD to monitor the remaining nine. |
||||
| .... | ||||
| With MD
working alone and having to record the data for nine
larvae, the methodology was slightly different. It was
impractical to record the glow duration for nine larvae,
so he concentrated on just recording the number of glows
produced. To help timing accuracy, MD used an old talking clock that could be operated by pressing the button with his feet, leaving hands free to record the times on paper. It was a technique which worked well, although the occasionally high number of glows from a number of larvae, did mean that data transfer onto paper became quite a hectic procedure. It was estimated that a minimum of two weeks monitoring would be required to provide us with enough data and so a single, two hour observation period on consecutive evenings was pre-selected. This was to run from 22:00h - 00:00h, with the start tme allowing for complete darkness by the beginning of each observation period. |
 |
|||
| .... | ||||
| Sometimes it
was not always possible to cover this period each evening
and in the event of this, the period 00:00h - 02:00h
could be selected by the observer(s) if neccessary. It is
not thought that the later observation period when used,
affected the results obtained. The observation periods ran from 29/08/12 - 22/09/12 for Larvae 1 and 2 (L1and L2); from 01/09/12 - 22/09/12 for L3, L4, L5 and L6 and from 05/09/12 - 22/09/12 for L7, L8, L9, L10 and L11. 2.0 ... Larval bioluminescence Observations to record larval bioluminescence over a two hour period ended on 22/09/12. By then, we believed that we had gathered enough data to be able to satisfy our own criteria and that the data would prove accurate enough for later publishing. MD continued monitoring his nine larvae on a more casual basis well into October and this served a useful purpose in confirming the information all observers had gathered from earlier results. 2.1 ... The bioluminescent rates produced by hunting/active larvae The results obtained were to surprise all three observers, with some quite staggering counts of larval bioluminesence (GPN) produced within the selected two hour observation periods. We found that not all larvae produced high counts of bioluminescent activity and certainly for five larvae used in the research, it was considerably less. MD also noted that L3 and L7, actually appeared to glow brighter than the other larvae in his charge. We were not able to differentiate between the bioluminescent brightness of L1 and L2, but obviously had a much smaller sample of larvae to enable any comparison. When the resulting figures in the Table 01 are examined, an obvious difference in the amount of bioluminesent activity produced by L1, 2, 3, 4, 6 and 7, is evident from that produced by L5, 8, 9, 10 and 11. |
||||
| .... | ||||
|
||||||||||||||||||||||||||||||||||||||||||||||||||||||||||||||||||||||||||
| .... | ||||||||||||||||||||||||||||||||||||||||||||||||||||||||||||||||||||||||||
| Even larvae producing the
highest GPN rates were not always active each night and
total diurnal or nocturnal inactivity was recorded from
all larvae at some point and often for several
consecutive nights. Larval feeding or post-feeding, was
found to be the primary cause of larval inactivity during
September and early October, but L8 remained inactive for
over 18 days until finally completing a moult on
20/09/12. The number of nights before larvae resumed glowing after completing feeding, was also found to vary between larvae. L1, 2, 6 and 7 were all recorded to glow the night following feeding, on at least one occasion and it is interesting to note that these four larvae also produced considerably higher total GPN rates than all the others. |
|
|||||||||||||||||||||||||||||||||||||||||||||||||||||||||||||||||||||||||||||||||||||||||||||||||||||||||||||||||||||||||||||||||||||||||||||||||||||||||||||||||||||||||||||||||||||||||||||||||||||||||||||||||
| .... | ||
| With the
conditions provided in captivity seeming ideal (warm and
humid), larval activity was still often confined to short
periods of time and of varying lengths, even among the
most active six larvae. No particular length of time, or
time period after dark, was found to trigger activity
from captive larvae. Bioluminescent activity and the
start of it, seemed to be completely random, but it was
noticed by MD, that larval bioluminescence could also be
shown by larvae when occasionally active during daylight
hours. Larvae could suddenly become active after a period of dormancy/inactivity during the selected observation period, or opposingly, could suddenly cease all activity and become dormant. Occasionally, individual larval activity did not begin until well after midnight, or larvae would again become active well into the early morning hours following earlier activity. The average GPN (glows per night) recorded for each larvae, over all observation periods, are shown in Table 01 and again splits the 11 larvae into two categories. The average GPN between the six larvae producing highest levels of bioluminescence (L1, 2, 3, 4, 6 and 7) and those producing the lowest rates (L5, 8, 9, 10 and 11) show a limited amount of variation in the GPN figures produced for both groups. Those larvae with the higher rate of activity produced a GPN range of 26.95 - 42.55 GPN, whilst larvae with a lower activity rate, produced a range of 1.83 - 9.16 GPN, excluding the returned 0.00 GPN showed by L8. If we look at the GPM (glows per minute) rates of the 11 captive larvae and group them according to their highest GPM rates, then we have virtually identical groupings of larvae, as based on the highest levels of bioluminescence just discussed. The only difference would be that L5, is now included in the group producing the highest GPM (L1, 2, 3, 4, 5, 6 and 7) and missing from the group producing the lowest GPM (L8, 9, 10 and 11). |
||
| .... |
| Table 02. .. Summary of bioluminescent activity produced by Larvae 1- 6 | ||||||||||||||||||||||||
| Clicking on the column headings (Larva 1, 2, 3 etc) in the tables below, will link to more detailed daily results for that larva. | ||||||||||||||||||||||||
| .... | ||||||||||||||||||||||||
| Larva 1 | Larva 2 | Larva 3 | Larva 4 | Larva 5 | Larva 6 | |||||||||||||||||||
| Date | ... | F/Dy | F/Av | T/Gl | ... | F/Dy | F/Av | T/Gl | ... | F/Dy | F/Av | T/Gl | ... | F/Dy | F/Av | T/Gl | ... | F/Dy | F/Av | T/Gl | ... | F/Dy | F/Av | T/Gl |
| 29/08/12 | ... | U | N | 37 | ... | U | N | 20 | ... | No data | ... | No data | ... | No data | ... | No data | ||||||||
| 30/08/12 | ... | N | N | 69 | ... | N | N | 8 | ... | No data | ... | No data | ... | No data | ... | No data | ||||||||
| 31/08/12 | ... | N | Y | 0 | ... | N | Y | 94 | ... | No data | ... | No data | ... | No data | ... | No data | ||||||||
| 01/09/12 | ... | N | Y | 0 | ... | Y | Y | 0 | ... | N | N | 18 | ... | N | N | 0 | ... | N | N | 0 | ... | N | N | 0 |
| 02/09/12 | ... | Y | Y | 0 | ... | N | Y | 0 | ... | N | Y | 379 | ... | N | N | 9 | ... | N | N | 3 | ... | N | N | 91 |
| 03/09/12 | ... | N | Y | 172 | ... | N | N | 33 | ... | Y | N | 0 | ... | N | N | 68 | ... | N | N | 0 | ... | N | Y | 65 |
| 04/09/12 | ... | N | Y | 31 | ... | N | N | 239 | ... | N | N | 0 | ... | Y | Y | 0 | ... | N | Y | 17 | ... | Y | Y | 0 |
| 05/09/12 | ... | Y | N | 6 | ... | N | N | 0 | ... | N | N | 0 | ... | N | N | 0 | ... | Y | Y | 0 | ... | N | Y | 14 |
| 06/09/12 | ... | N | N | 2 | ... | N | N | 1 | ... | N | N | 9 | ... | N | N | 0 | ... | Y | Y | 0 | ... | N | N | 0 |
| 07/09/12 | ... | N | N | 4 | ... | Y | Y | 3 | ... | N | N | 2 | ... | N | N | 5 | ... | N | N | 0 | ... | N | N | 11 |
| 08/09/12 | ... | N | N | 84 | ... | N | N | 0 | ... | N | Y | 22 | ... | N | N | 116 | ... | N | N | 0 | ... | N | N | 75 |
| 09/09/12 | ... | N | N | 2 | ... | N | N | 39 | ... | Y | Y | 1 | ... | N | Y | 76 | ... | N | Y | 0 | ... | N | N | 264 |
| 10/09/12 | ... | N | Y | 295 | ... | N | N | 0 | ... | Y | N | 0 | ... | Y | Y | 0 | ... | Y | N | 0 | ... | Y | N | 32 |
| 11/09/12 | ... | N | Y | 0 | ... | N | N | 0 | ... | N | N | 0 | ... | Y | N | 0 | ... | Y | Y | 10 | ... | N | N | 123 |
| 12/09/12 | ... | N | Y | 1 | ... | N | Y | 0 | ... | N | N | 19 | ... | N | N | 0 | ... | N | N | 0 | ... | U | N | 17 |
| 13/09/12 | ... | Y | Y | 1 | ... | N | Y | 0 | ... | N | Y | 101 | ... | N | Y | 0 | ... | N | Y | 0 | ... | N | Y | 95 |
| 14/09/12 | ... | N | Y | 0 | ... | Y | Y | 0 | ... | N | N | 32 | ... | N | N | 0 | ... | N | N | 0 | ... | Y | Y | 4 |
| 15/09/12 | ... | Y | Y | 0 | ... | Y | Y | 0 | ... | N | N | 0 | ... | N | Y | 0 | ... | N | Y | 2 | ... | N | Y | 0 |
| 16/09/12 | ... | N | N | 0 | ... | N | N | 178 | ... | Y | Y | 1 | ... | N | N | 29 | ... | N | N | 0 | ... | N | Y | 0 |
| 17/09/12 | ... | N | N | 0 | ... | N | N | 213 | ... | Y | Y | 0 | ... | N | N | 0 | ... | N | Y | 0 | ... | N | Y | 8 |
| 18/09/12 | ... | N | N | 0 | ... | N | N | 20 | ... | N | N | 0 | ... | N | N | 0 | ... | N | N | 22 | ... | N | N | 51 |
| 19/09/12 | ... | N | Y | 0 | ... | Y | Y | 33 | ... | N | N | 0 | ... | N | N | 0 | ... | N | N | 10 | ... | N | N | 15 |
| 20/09/12 | ... | No data | ... | No data | ... | N | N | 0 | ... | N | N | 0 | ... | N | N | 0 | ... | Y | Y | 0 | ||||
| 21/09/12 | ... | N | Y | 0 | ... | Y | N | 0 | ... | N | Y | 0 | ... | N | Y | 0 | ... | N | Y | 0 | ... | N | Y | 0 |
| 22/09/12 | ... | N | Y | 8 | ... | N | N | 0 | ... | Y | Y | 9 | ... | Y | Y | 4 | ... | Y | Y | 3 | ... | Y | Y | 5 |
| Table 03. .. Summary of bioluminescent activity produced by Larvae 7- 11 | ||||||||||||||||||||||||
| .... | ||||||||||||||||||||||||
| Larva 7 | Larva 8 | Larva 9 | Larva 10 | Larva 11 | ||||||||||||||||||||
| Date | ... | F/Dy | F/Av | T/Gl | ... | F/Dy | F/Av | T/Gl | ... | F/Dy | F/Av | T/Gl | ... | F/Dy | F/Av | T/Gl | ... | F/Dy | F/Av | T/Gl | ... | F/Dy | F/Av | T/Gl |
| 03/09/12 | ... | No data | ... | No data | ... | No data | ... | No data | ... | No data | ... | ... | ||||||||||||
| 04/09/12 | ... | No data | ... | No data | ... | No data | ... | No data | ... | No data | ... | ... | ||||||||||||
| 05/09/12 | ... | N | Y | 133 | ... | N | Y | 0 | ... | N | Y | 17 | ... | Y | Y | 0 | ... | N | Y | 0 | ... | ... | ... | ... |
| 06/09/12 | ... | N | N | 0 | ... | N | Y | 0 | ... | N | Y | 26 | ... | N | Y | 0 | ... | N | Y | 0 | ... | ... | ... | ... |
| 07/09/12 | ... | Y | Y | 0 | ... | N | Y | 0 | ... | N | Y | 0 | ... | N | N | 0 | ... | N | Y | 0 | ... | ... | ... | ... |
| 08/09/12 | ... | N | N | 44 | ... | N | N | 0 | ... | N | Y | 0 | ... | N | N | 0 | ... | N | Y | 0 | ... | ... | ... | ... |
| 09/09/12 | ... | N | N | 0 | ... | N | N | 0 | ... | N | Y | 56 | ... | N | N | 0 | ... | N | Y | 0 | ... | ... | ... | ... |
| 10/09/12 | ... | N | N | 0 | ... | N | Y | 0 | ... | N | Y | 39 | ... | N | N | 0 | ... | N | Y | 0 | ... | ... | ... | ... |
| 11/09/12 | ... | N | N | 137 | ... | N | Y | 0 | ... | N | Y | 2 | ... | N | N | 0 | ... | N | Y | 5 | ... | ... | ... | ... |
| 12/09/12 | ... | U | N | 96 | ... | N | Y | 0 | ... | N | Y | 7 | ... | N | N | 0 | ... | U | N | 6 | ... | ... | ... | ... |
| 13/09/12 | ... | N | Y | 80 | ... | N | Y | 0 | ... | N | Y | 8 | ... | N | Y | 0 | ... | N | Y | 0 | ... | ... | ... | ... |
| 14/09/12 | ... | Y | Y | 162 | ... | N | Y | 0 | ... | N | Y | 9 | ... | N | Y | 0 | ... | N | Y | 28 | ... | ... | ... | ... |
| 15/09/12 | ... | N | Y | 0 | ... | N | Y | 0 | ... | N | Y | 3 | ... | Y | Y | 33 | ... | Y | Y | 0 | ... | ... | ... | ... |
| 16/09/12 | ... | N | Y | 0 | ... | N | Y | 0 | ... | Y | Y | 0 | ... | Y | Y | 0 | ... | N | Y | 0 | ... | ... | ... | ... |
| 17/09/12 | ... | N | N | 0 | ... | N | Y | 0 | ... | Y | Y | 0 | ... | Y | N | 0 | ... | N | Y | 0 | ... | ... | ... | ... |
| 18/09/12 | ... | N | N | 1 | ... | N | Y | 0 | ... | N | N | 0 | ... | N | N | 0 | ... | N | N | 0 | ... | ... | ... | ... |
| 19/09/12 | ... | N | N | 0 | ... | N | Y | 0 | ... | N | N | 0 | ... | N | N | 0 | ... | N | N | 0 | ... | ... | ... | ... |
| 20/09/12 | ... | N | N | 0 | ... | N | Y | 0 | ... | N | N | 0 | ... | N | N | 0 | ... | Y | Y | 0 | ... | ... | ... | ... |
| 21/09/12 | ... | N | Y | 14 | ... | N | Y | 0 | ... | N | Y | 0 | ... | N | Y | 0 | ... | N | Y | 0 | ... | ... | ... | ... |
| 22/09/12 | ... | N | Y | 5 | ... | N | Y | 0 | ... | Y | Y | 0 | ... | N | Y | 0 | ... | N | Y | 0 | ... | ... | ... | ... |
| Figure 01. .. The combined GPN activity profile of larvae 1 - 11 during September 2012 | ||
| .. | ||
 |
The seasonal timing of
our larval bioluminescence research was
quite fortunate, in that it covered the period when
larval activity showed a sudden decline. This decline was
noted from both captive larvae and those found in the
wild as part of Project 2; Phase 1. 2012. Wild larvae were primarily being studied to determine the size range of larvae in the wild during late Summer and Autumn, but in order to locate larvae for data collection, we first had to find them. This was done after dark, when we looked for the bioluminescent glows produced by larvae at a Sherwood Forest site. Sudden reduction in bioluminescent activity was noted from both wild and captive larvae around mid-September. This was actually found to coincide nicely at the point where both day and night become of equal length. The combined GPN activity profile of all larvae in Figure 01 shows this decline. |
|
| .. | ||
| 2.2 ... Variations within the
duration of larval bioluminescence exhibited by active
larvae One of the aspects of larval bioluminescence we wanted to research, was variation in glow duration of hunting/mobile larvae. To do this, we timed the duration of each glow from L1 and L2, then calculated the average across each two hour observation period. Occasionally, larvae glow for extended periods of over ten seconds, so two sets of figures are given in the results. Six individual glows during a two hour observation period was believed to be the lowest total high enough, from which to derive an accurate average glowing length. A total number of glows below six, is signified in Table 04 by "insufficient data". Table 04 shows the data obtained from L1 and L2 on a total of 24 dates between 29/08/12 and 22/09/12. No data is available for 20/09/12, as we were recording larvae in Sherwood Forest as part of Project 2: Phase 1. 2012. |
||
| .. | ||
| Table 04. .. Bioluminescence duration shown by larvae 1 and 2 | ||||||||||||
| .. | ||||||||||||
| Larva 1 | Larva 2 | |||||||||||
| ... | ... | ... | Average glow duration | ... | ... | ... | Average glow duration | ... | ||||
| Date | Larva fed Y/N | Not including 10+ second glows | Including 10+ second glows | 10+sec glow count | Larva fed Y/N | Not including 10+ second glows | Including 10+ second glows | 10+sec glow count | ||||
| 29/08/12 | .... | N | 3.68sec/370 | .... | 0 | .... | N | 3.45sec/200 | .... | 0 | ||
| 30/08/12 | ... | N | 3.47sec/690 | .... | 0 | ... | N | 3.12sec/800 | .... | 0 | ||
| 31/08/12 | ... | N | .... | .... | .... | ... | N | 2.61sec/940 | .... | 0 | ||
| 01/09/12 | ... | N | .... | .... | .... | ... | Y | .... | .... | .... | ||
| 02/09/12 | ... | Y | .... | .... | .... | ... | N | .... | .... | .... | ||
| 03/09/12 | ... | N | 4.51sec/167 | 4.81sec/172 | 5 | ... | N | 3.87sec/330 | .... | 0 | ||
| 04/09/12 | ... | N | 3.80sec/300 | 4.00sec/310 | 1 | ... | N | 3.28sec/239 | .... | 0 | ||
| 05/09/12 | ... | Y | 4.16sec/600 | .... | 0 | ... | N | .... | .... | .... | ||
| 06/09/12 | ... | N | Insufficient data/2 | ... | 0 | ... | N | Insufficient data/1 | ... | 0 | ||
| 07/09/12 | .... | N | Insufficient data/4 | .... | 0 | .... | Y | Insufficient data/3 | See larva 2 account | 3 | ||
| 08/09/12 | ... | N | 3.79sec/830 | 3.96sec/84 | 1 | ... | N | ... | ... | .... | ||
| 09/09/12 | .... | N | Insufficient data/2 | .... | 0 | .... | N | 2.84sec/390 | .... | 0 | ||
| 10/09/12 | ... | N | 4.23sec/295 | ... | 0 | ... | N | ... | ... | .... | ||
| 11/09/12 | ... | N | ... | ... | .... | ... | N | ... | ... | .... | ||
| 12/09/12 | ... | N | Insufficient data/1 | ... | 0 | ... | N | ... | ... | .... | ||
| 13/09/12 | ... | Y | Insufficient data/1 | ... | 0 | .... | N | .... | .... | .... | ||
| 14/09/12 | ... | N | ... | ... | ... | ... | Y | ... | ... | ... | ||
| 15/09/12 | ... | Y | ... | ... | ... | ... | Y | ... | ... | ... | ||
| 16/09/12 | ... | N | ... | ... | ... | ... | N | 4.27sec/177 | 4.31sec/178 | 1 | ||
| 17/09/12 | ... | N | ... | ... | ... | ... | N | 4.27sec/210 | 4.35sec/213 | 3 | ||
| 18/09/12 | ... | N | ... | ... | ... | ... | N | 4.00sec/200 | ... | 0 | ||
| 19/09/12 | ... | N | ... | ... | ... | ... | Y | 2.61sec/310 | 3.27sec/330 | 2 | ||
| 20/09/12 | ... | N | No data available | ... | ... | Y | No data available | ... | ||||
| 21/09/12 | ... | N | ... | ... | ... | ... | Y | ... | ... | ... | ||
| 22/09/12 | ... | N | 2.50sec/800 | ... | 0 | ... | N | ... | ... | ... | ||
| ... | ||||||||||||
| * Figure after forward slash represents the total number of glows that average glow duration is calculated from | ||||||||||||
| ... | ||
| Both larvae
were of similar (23-24mm) size, so with this data there
are no size differences to factor in when we look at the
results, but a similar study using much smaller larvae
would be very useful in enabling a comparison between the
bioluminescent glow durations produced by larvae of
different size ranges. The average bioluminescent glow
duration of a 23-24mm larva, showed an obvious increase
after feeding, but became shorter the longer the larva
went without food. The total average glow duration on nights when bioluminescent activity was produced, shows remarkable similarity for both larva. Table 05, provides a summary of the combined average glow duration data for L1 and L2. |
||
| ... |
|
|||||||||||||||||||||||||||||||||||||||||||||||||||||||||||||||||
| ... | |||||||||||||||||||||||||||||||||||||||||||||||||||
| If we first
look at the results not including glows over ten seconds,
we found that L1 produced an average glow duration of
3.78sec/705 and L2 an average glow duration of
3.43sec/870. This equates to a glow duration difference
of 0.35sec between L1 and L2 and an average glow duration
of 3.60sec, when we combine the results for both larvae.
If the recorded number of bioluminescent glows over 10+
seconds duration are incorporated, then L1 produces an
average of 4.25sec/712 and L2 produces an average of
3.97sec/879, with a difference between both larvae of
just 0.28sec. Long duration bioluminescent glows of 10+ seconds were extremely unusual in hunting or mobile larvae in captivity. Adding the total GPN for L1 and L2 from Table 01, we get a total of 1,591/48 GPN (48 representing the total number of observation periods). Out of this total, the number of 10+ second bioluminescent glows recorded was just 16, which equates to a rate of about 1.00%. |
|||||||||||||||||||||||||||||||||||||||||||||||||||
| ... | |||||||||||||||||||||||||||||||||||||||||||||||||||
| Working on both research projects actually proved especially useful and we were eventually able to gather a limited amount of data on the bioluminescent glow duration of two wild larvae found on 15/09/12 (10 minutes obs) and 19/10/12 (15 minutes obs). Bioluminescent activity had ceased from the 11 captive larvae by early October and had also become an increasingly rare phenomenon in the wild, with larvae occasionally being found on the more mild and moonless evenings. |
|
||||||||||||||||||||||||||||||||||||||||||||||||||
| ... | |||||||||||||||||||||||||||||||||||||||||||||||||||
| In the wild, it was soon
noted that larval bioluminescent glow duration produced
by hunting larvae, was quite obviously longer than that
produced by captive larvae, but that the GPM (glows per
minute) and GPN (glows per night) rates of wild larvae
were considerably less than most captive larvae, although
in line with those captive larvae showing a low GPM rate. Although the data gathered from the two wild larvae is limited, we believe that there is enough available data to use as a direct comparison with captive larvae, if we use the averages for L1 and L2. A comparison between the average glow durations of L1 and L2 against the two wild larvae, are given in Table 06. A wild larva found on 15/09/12 was recorded glowing eight times within a ten minute observation period. Two bioluminescent glows lasted for 10 seconds, leading to an average glow duration of 7.33sec/6 if the 10+sec glows are taken out of the calculations. Add in the 10+sec duration glows and an average glow duration of 8.00sec/8 is reached. Based on this single observation, the larva had a maximum GPM rate of 2.00. The bioluminescent data for the second wild larvae found on 19/10/12, gives averages of 7.88sec/4, if the 10+sec glows are taken out of the calculations and 12.46sec/13 with the inclusion of 10+sec duration glows. What was interesting about this larva, was the high number of long duration glows, producing nine long glows out of a total of 13 in a 15 minute observing period, including single glows of 20sec and 26sec duration. This larva also produced a maximum GPM rate of 2.00. |
 |
|
| .. | ||
| 2.3 ... Detectable patterns in the
bioluminescent glows produced by hunting/active larvae Observations revealed that hunting larvae were capable of producing an extraordinary number of glows and differed in the number and frequency of glows produced, but a definite pattern of peaks and troughs within the glowing activity was found. This was most evident on evenings when larvae were extremely active, often producing a continuous series of glows throughout the two hour observation periods, when visual detection of both the end and start points of separate bioluminescent glows became almost impossible. The 'y' axis scale on the left represents the number of glows per minute. |
||
| .. | ||
| Figure 02. .. The high bioluminescent activity profile produced by Larva 3 on 02/09/12 |
 |
| .. | ||
| Typically,
peaks of bioluminescent activity lasted between 7-11
minutes in duration, although it was not totally unusual
for there to be no discernable pattern to the results at
all. Occasionally, peaks of bioluminescent activity stood
out against a background of constant low level activity,
or bioluminescent activity rates would suddenly increase
from low level activity or complete larval dormancy. On 13 occasions, the number of glows produced by a single larva was recorded at well over 100 times per two hour observation period. The highest GPN (glows per night) rate recorded, was a staggering 379 by L3 on 02/09/12, averaging 3.15 GPM (glows per minute). This is illustrated in Figure 02, but two other good examples of high GPN rates are illustrated in Figure 03 and Figure 04. These two graphs show two different high bioluminescent activity profiles and illustrate very well, how even high levels of larval activity can vary. |
||
| .. |
| Figure 03. .. The bioluminescent activity profile produced by larva 1 on 04/09/12 |
 |
| .. |
| Figure 03a. .. Breakdown of the bioluminescent activity profile produced by Larva 1 on 10/09/12 |
 |
| .. |
| Figure 03a shows the activity profile produced by L1 on 10/09/12, but we have broken the data down to show the individual bioluminescent glow lengths for each minute. Note that the 'y' axis scale on the left now represents the time (in seconds) of each larval glow, rather than the number of glows. This graph records the breakdown of the larva's GPN and GPM in more detail. |
| .. |
| Figure 04. .. The bioluminescent activity profile produced by Larva 1 on 10/09/12 |
 |
| .. |
| Figure 04a. .. Breakdown of the same bioluminescent activity profile, produced by Larva 1 on 10/09/12 in Figure 04. |
 |
| .. |
| The activity profile
shown in Figure 04, also looks quite different if we
split the data up to include each bioluminescent glow
length as in Figure 04a. Space restricts the size of this
graph, but it is possible to make out that the duration
of the first glow in any series of glows, actually
remains fairly constant at all times and it was the third
and fourth glows in a series, that typically tended to
show the most variation. The first glow was usually
followed by a glow of at least equal duration. It was noticed after studying the resulting data from the observing periods, that we could split our captive larvae into two groups based on their low level activity profiles, i.e. their low GPN and GPM rates. Larval size was not a factor we believed that we had to consider, as all 11 larvae were still at least several months away from being full grown. |
| .. |
| Figure 05. .. The low bioluminescent activity produced by Larva 9 on 05/09/12 |
 |
| .. |
| High activity levels were
unusual among captive larvae and the activity profile
shown in Figure 05, shows the typical bioluminescent
activity profile recorded from larvae producing the
lowest GPN (L5, 8, 9, 10 and 11) and GPM rates (L8, 9, 10
and 11). These larvae often produced a series of well
spaced, singular glows, just about discernable into four
definite periods of bioluminescent activity during the
two hours observation. Our present theory, is that larvae with low GPM and GPN rates, eventually develop into adult males. 2.4 ... The occurrence of long duration bioluminescent glows from captive and wild larvae That there could possibly be a way to separate male and female larvae based on an aspect (or aspects) of larval bioluminesence, was something we had discussed many months before the start of our Project 2: Phase 1. 2012 research in July and August 2012. The origin of our theory was not based on larval GPN or GPM rates, but as a potential explanation for the very long duration glows often recorded from larvae in the wild. Section 2.2 dealt with variations found within the duration of larval bioluminescence exhibited by hunting/mobile larvae, where a glow of over ten seconds was the criteria required to assign a glow as being of long duration. But this referred only to larvae which were actively hunting or mobile and we felt it neccessary to have a different criteria for long duration bioluminescence from stationary larvae. As the captive larvae were being observed without the use of bright artificial light, we had to ensure that the criteria used in determining long duration bioluminesence between hunting and stationary larvae was not misinterpreted and decided that a higher minimum glow length would help differentiate between stationary and hunting/mobile larvae long duration bioluminesence. This was established at the start of both research projects, with 20 seconds decided as being the most appropriate minimum length of time. Table 07 lists all the long duration (20+sec) bioluminesent glows produced by captive larvae 1 - 11. Bioluminesence longer than 20 seconds from active larvae was extremely rare, occurring just once out of a total of 4,431 larval glows recorded between 29/08/12 and 22/09/12. Yet within a few days of ending this area of our larval bioluminescence research, three long duration glows were recorded from L1 and L11, occurring after normal hunting/mobile bioluminescence had declined. Two glows produced by L1 on 01/10/12, were the only glows we recorded from both L1 and L2 after 22/09/12. MD also noted the sudden decrease in the number of hunting/mobile glows from larvae 3 - 11, but did record a single glow of over two minutes by L11 on 06/10/12. |
| .. |
| Table 07. .. 20+ second long duration glows recorded from captive larvae | ||||||||
| .. | ||||||||
| Date | Larva No | Notes | Glow 1 | Glow 2 | ||||
| .. | ||||||||
| 07/09/12 | .. | L2 | .. | Two feeding glows about 30 minutes apart | .. | 00h:06m:12s | .. | 00h:24m:16s |
| 09/09/12 | .. | L3 | .. | Feeding glow | .. | 00h:30m:00s | .. | .. |
| 13/09/12 | .. | L1 | .. | Feeding glow | .. | 00h:19m:10s | .. | .. |
| 14/09/12 | .. | L7 | .. | Feeding glow noted around 01:00h | .. | 00h:10m:00s | .. | .. |
| .. | .. | L6 | .. | Feeding glow | .. | 02h:01m:00s | .. | .. |
| 16/09/12 | .. | L3 | .. | Feeding glow | .. | 00h:35m:00s | .. | .. |
| 18/09/12 | .. | L6 | .. | Feeding glow | .. | 01h:08m:00s | .. | .. |
| .. | .. | L7 | .. | Single long duration glow | .. | 00h:01m:15s | .. | .. |
| 01/10/12 | .. | L1 | .. | Two consecutive long duration glows | .. | 00h:01m:25s | .. | 00h:01m:38s |
| 02/10/12 | .. | L3 | .. | Feeding glow | .. | 00h:01m:15s | .. | .. |
| 06/10/12 | .. | .L11 | .. | Single long duration glow | .. | 00h:02m:30s | .. | .. |
| 06/11/12 | .. | L1 | .. | Feeding glow | .. | 04h:35m:00s | .. | .. |
| The sudden
drop in GPN rates and larval bioluminescence from captive
larvae, was found to coincide with a decrease in
bioluminescent activity from wild larvae. Looking at the
percentages for long duration glows we recorded from wild
larvae as part of Project 2: Phase 1. 2012, the rate of
larvae producing 20+ second bioluminesent glows suddenly
rose from 5.3% (from a recorded total of 113 larvae) in
August, to 15.38% (26 larvae) in September and then
16.12% (31 larvae) in October. So while larvae were
actually less inclined to glow, the proportion of long
duration glows showed a marked increase from September
onwards. We believe that we are almost able to rule out temperature change as being a cause for this drop in GPN rates. In captivity, L1 and L2 (TDP) were kept in an unheated, naturally warm room at a constant temperature of 18 - 20°C, with larvae 3 - 11 (MD) also in an unheated room, but subject to greater temperature fluctuations of 12 - 17°C. Outdoor temperatures recorded from the Sherwood Forest site used for our wild larvae research, ranged from 6 - 17°C between August and October. Despite the constantly warm temperatures L1 and L2 were kept at, the decline and eventual cessation of larval bioluminescence was in accordance with captive larvae kept in lower temperatures and with larvae in the wild. It seems that the contributing factor had to be the change in day/night length and around September 25th, when night lengths finally exceed 12 hours. |
| .. | ||
| 2.5 ... Extreme periods of
bioluminescence exhibited by feeding larvae Table 07 also lists instances of extremely long duration bioluminescent glows produced on several occasions by feeding larvae. We later termed these "feeding glows", which were characterised by their extreme longevity and faintness, although they could be interrupted by short periods of non-bioluminescence. |
||
| .. |
 |
 |
|
| .. | ||
 |
Feeding larvae usually
maintained continued bioluminescence well into the early
morning hours, if seen to catch and then start to consume
prey during one of the larval observing periods we
carried out in September and additional casual
observations later in the Autumn. If prey was caught and feeding commenced during daylight, feeding glows were not observed when it subsequently became dark, even if larvae were still continuing to feed. As with other types of larval bioluminescence, we recorded a general decline in the number of feeding glows observed during September and although feeding did continue, feeding glows were rarely recorded after early October. Another potentially interesting observation was that feeding glows were not produced by all larvae that caught prey during September's observing periods. |
|
| .. | ||
| Checking back through our observational notes made at the time, feeding glows were not observed from L5 on 11/09/12 and L10 on 15/09/12 during observations made by MD on those nights. Table 07 also reveals that feeding glows were only noted from L1, 2, 3, 6 and 7 during the observation periods, all of which were grouped among those larvae showing the highest GPN rate (L1, 2, 3, 4, 6 and 7). | ||
| 3.0 ... Hunting and feeding Larval hunting was not something we had actually discussed researching before we engaged in Project 1: Phase 1. 2012, but we feel it useful to publicise our observations to a wider readership here. Initially, we were more interested in the bioluminescent activity produced by larvae upon the detection of prey, and any bioluminescent reaction produced when larvae came into direct contact with other invertebrates and potential predators. The clear advantage of having a number of larvae in captivity, meant that larval hunting and the detection of and immobilisation of prey items, could be observed under more controlled conditions than are possible through field observations. Although we do have first hand experience of larval hunting in the wild, a captive environment was much more suitable for research purposes. 3.1 ... Conditions conducive to larval activity and bioluminescence Determining the suitability of conditions leading to general, or increased larval activity, proved difficult and there is plenty of scope for a more detailed long-term study into determining what particular conditions (if any), are most conducive to larval activity and bioluminescence associated with hunting/mobility. From our own research and observations, larval activity is dependant on moisture, humidity, temperature, nocturnal feeding, post-feeding dormancy and moult preparation and/or recovery. |
||||
| .. |
| But even when
provided with conditions which seemed ideal, larval
activity still always seemed to be on an individual basis
and we were unable to find enough evidence to suggest
that any one particular factor, or collective number of
factors, could really induce activity from all 11 larvae
on or around the same date. The two substrate types and average room temperatures used in both our own (TDP) and MD's larval observation setups, allowed for varying levels of moisture, humidity and temperature levels to be tested. The peat and soil substrate favoured by MD for larvae 3 - 11 was kept generally damp throughout the larval observations of August and September, but did have to be watered occasionally. The stony substrate used by TDP, dried out considerably quicker and although perhaps more representative of the substrate conditions found locally in Sherwood Forest, substrate was subsequently shown not to be the important factor. |
 |
|||
| .. | ||||
| Having two
very different substrates did prove a useful exercise and
we obtained clear evidence that larval hunting and
bioluminescent activity could substantially increase the
evening following substrate watering. But this was only
evident from larvae which consistantly produced higher
GPN rates. Watering (and subsequent higher humidity
levels) certainly seemed to be an influencing factor
leading to several three figure GPN counts recorded
during our larval observation periods. But we were unable to determine if temperature had any definitive effect on larval activity in a captive environment, with little temperature variation (17 - 20°C between TDP's and MD's setups) during August and September. Even when provided with a consistantly warm setup, larval activity still showed a greater amount of variation than we had expected. But this does not mean that temperature is not altogether a conducive factor towards larval activity, because on-going research as part of Project 2: Phase 1. 2012 has found evidence to suggest that larvae do respond to temperature increases in the wild, but will also be dependant on other contributing factors listed at the beginning of section 3.1. Post-feeding dormancy was another contributing factor towards larval activity. While most larvae would not become active for several evenings after feeding on substantial prey items, it was not unknown (within the short period of our captive observations) for larvae to resume bioluminescent activity the evening following completion of feeding. |
||||
| .. | ||
| 3.2 ... Larval bioluminescence
during the detection and capture of prey items The whole aspect of larval hunting and prey detection has always been open to debate. There are certainly two theories, one suggesting of deliberate (intelligent?) larval hunting techniques and the other that both hunting and prey detection are just completely random processes. Either way, regular larval bioluminescence would probably be a characteristic of both suggestions, even though it would have no significance in hunting methods. But we were interested in seeing if bioluminescence was perhaps representative as an indicator of larval awareness of prey items, or was increased at the moment of prey location and capture. Larval bioluminescence at the moment of prey location, was one of the main aspects of Project 1: Phase 1. 2012 and observing larvae in captivity was the only practical method to observe this, but we were unable to devote the required amount of hours to this aspect of our research in 2012 for anything conclusive to show. We were particularly interested in looking for any obvious changes in the larval glow rate, or in the bioluminescent activity pattern produced at the time of prey location and how long bioluminescence was maintained after capture. Observations revealed that hunting was almost certainly, a totally random process and prey items seemed to be located purely by chance. A larva could quite easily miss a meal, just by walking the wrong side of a stone or other obect on the substrate. We looked for indications that larvae deliberately followed the mucus trails left by prey, but were unable to find any really conclusive evidence to support the theory that they actually did. When larvae were particularly active, bioluminsecent activity did appear to increase where larvae were recorded spending more time on areas of the substrate where prey had been present previously. This may have been down to larvae coming up against a natural obstacle on the substrate, or in the case of L1 and L2, a corner of the container and then being indecisive about which way to go next. Again, we could find no firm evidence to suggest that larvae deliberately tracked intended prey by following mucus trails. We also found no real evidence to show that larvae glowed more frequently when prey items were available. Even when larvae were active during one of the larval observation periods, the amount of bioluminescent activity (GPN and GPM) was only once obviously higher than an averaged activity level. This is shown by L1 between 23:16h and 23:33h in Figures 04 and 04a. However, we did find some evidence to show that larvae do glow well at the moment of finding and biting food, but unfortunately not well enough to be consistantly discernable above general bioluminescent activity preceding prey detection. |
||
| .. | ||
 |
 |
|
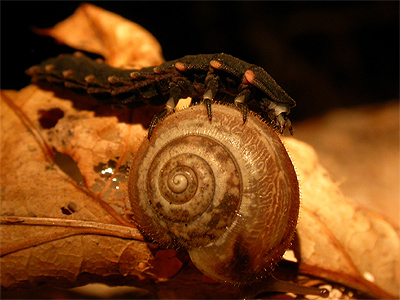
| .. | ||
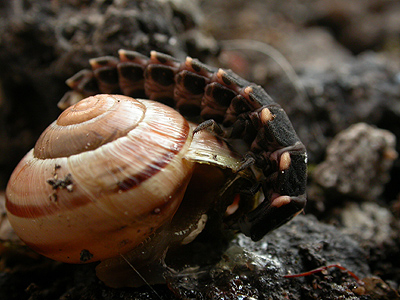
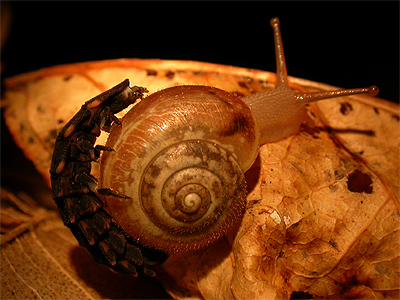
| Searching for larvae in the wild as part of Project 2: Phase 1. 2012, we were fortunate to find a larva on 23/08/12 that had just located a prey item. In this instance, the prey was a Hairy Snail Trochulus hispidus (shown above) and the larva was recorded glowing three times, with recorded glow durations of approximately 1.50, 2.00 and 2.00 seconds. Interestingly, these durations were shorter than those recorded from any of our captive larvae. We recorded no larval bite during our observation and from prey capture observed in captivity, believe that we had photographed this larva, literally at the moment of prey detection. | ||
| .. | ||
 |
 |
|
| .. | ||
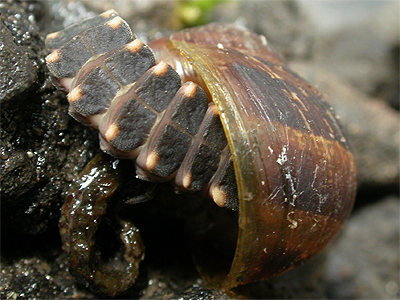
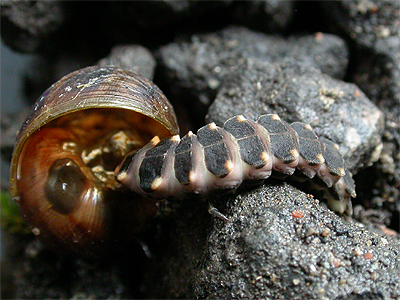
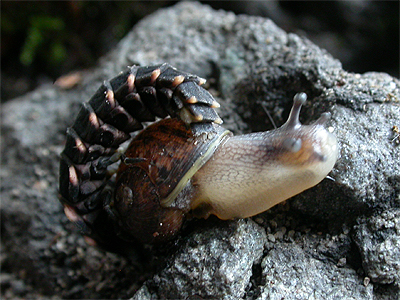
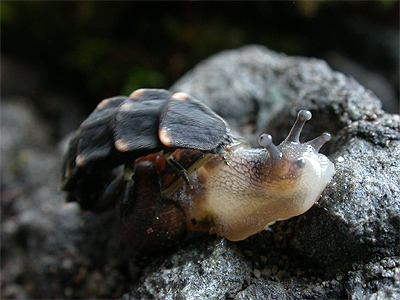
| Although
offered a choice of prey items by ourselves and MD,
Snails were clearly the preferred target prey over Slugs.
White-lipped Snail (Cepaea hortensis)
and sub-adult Garden Snail (Cornu aspersum)
were the prey species offered to larvae in captivity.
Larvae were quite capable of taking prey items
considerably larger than themselves, though the larger
the prey, the more bites had to be inflicted by the
larvae. Large prey items such as that shown in the above
photographs took many bites before they became still and
prey items as large as this, can take over two hours to
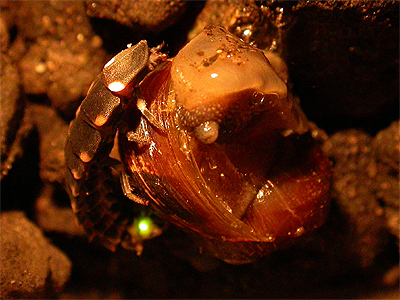
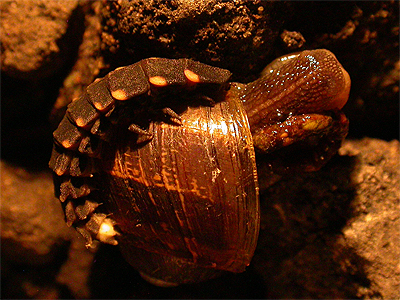
become immobile/die. It soon became obvious that Snails were less likely to be lost by the larva after the initial bite. Although both Slugs and Snails recover quite quickly from a single bite, Slugs would often get 'lost' by the larva as they move away, despite the Glow Worm larva circling them. Snails however (when bitten initially) retreat into the shell and in all the instances of Snail capture we observed, the larva climbed straight onto the shell and remained in situ before inflicting the first bite and remained on the shell until the prey was dead. |
||
| .. | ||
 |
 |
|
| .. | ||
 |
 |
|
| .. | ||
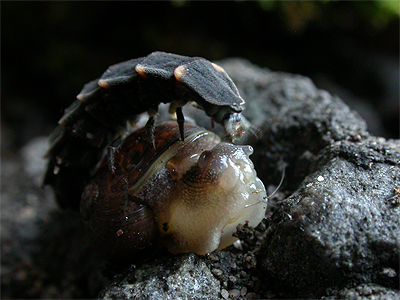
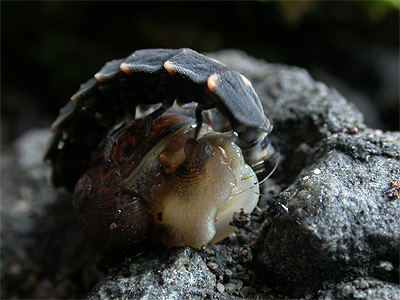
| This tactic of climbing
onto the shell, ensured a 100% prey capture success rate.
If the larva found itself facing the wrong way after
climbing onto the shell (above four photographs, left to
right) it would soon turn round and then inflict the
first of several bites at the back of the head. Further
bites would continue until all prey movement stopped. The
clear advantage of this capture method, is that if the
snail moves off after being bitten, the larva is carried
with it and does not lose its prey, even if carried
through vegetation. Larvae cling on tenaciously and on
one occasion MD observed a snail, complete with larva,
several metres across the floor, after the Snail had
managed to climbed out and escape from the container. Figure 06 shows the bioluminesent activity profile produced by larva 2 after attacking a sub-adult Garden Snail (Cornu aspersum) prior to the start of a two hour observation period at 21:35h. Our notes made at the end of the observation period, stated that the Snail was still moving slightly at 00:00h, with the larva still on the shell but had not commenced feeding. |
| .. |
| Figure 06. .. Bioluminesent activity profile produced by larva 2 after attacking Snail |
 |
| .. |
| Analysing the data shows from a total of 33 glows recorded after 22:00h, included two non-feeding, long duration glows of 12.00 and 15.00 seconds. The average glow length was 2.61sec/31, with an average of 3.27sec/33, if the recorded number of bioluminescent glows over 10+ seconds duration are included. Bioluminescence stopped at 23:19h. |
| .. |
| 3.3 ... Larval feeding The number of prey items taken by each captive larva shown in Table 09, are thought to be accurate, although there may have been times when feeding on small prey items took place out of sight of the observer. Even taking into account the differences in larval size, it became apparent that some larvae were less able to hunt and kill as effectively as others. As a large larva, L8 only managed to kill 2 prey items and remained inactive and dormant for much of the time, but eventually went on to complete a lengthy moult. Conversely, L1, 2 and 3 all appeared to have a large appetites, often feeding for extended periods and swelling to more than twice their original size. Feeding by all larvae reduced sharply towards the end of September/early October, with L5 the last larvae recorded to feed on the 23/11/12. Despite by now being in an obvious state of diapause, L1 and 2 were easily encouraged to take food on 06/11/12, although when prey was placed adjacent to them, it did take a minute or so for full activity to commence. Once they were aware of it, prey was despatched in the usual manner. |
|||||||||||||||||||||||||||||||||||||||||||||||||||||||||||||||||||||||||||||||||||||||||||||||||||||||||||||||||||||||
| . | |||||||||||||||||||||||||||||||||||||||||||||||||||||||||||||||||||||||||||||||||||||||||||||||||||||||||||||||||||||||
|
No feeding glows were noted from either larva despite being deliberately looked for, although this may have been due to the prey being caught during daylight hours. Even with a constantly high room temperature of 18°C - 20°C, larval diapause resumed after feeding. | ||||||||||||||||||||||||||||||||||||||||||||||||||||||||||||||||||||||||||||||||||||||||||||||||||||||||||||||||||||||
| . | |||||||||||||||||||||||||||||||||||||||||||||||||||||||||||||||||||||||||||||||||||||||||||||||||||||||||||||||||||||||
| What was
striking though, was how some larvae appeared to prey on
Snails during the late Autumn, but actually failed to
kill or feed on them. Initially, this was seen as
effective attacking of the prey by MD, evoking defensive
foaming reactions from the Snail. But after failing to
complete the kill, the Snail quickly recovered and moved
off. All larvae eventually seemed to lose complete
interest in feeding late in the year, a fact which
surprised us, thinking that every available opportunity
would be taken to increase larval body weight, prior to
over-wintering. As the Autumn progressed, larval attacks
on prey became further reduced and by late November/early
December, most larvae seemed unable to even recognise
Snails as prey items, often crawling over them before
moving off. L6, 9 and 11 seemed to be prone to this more
than the other larvae. It would also be expected that nocturnal hunters would be encouraged to hunt for longer as the nights lengthen, even when the temperature was as conducive to larval activity in late October/early November, as it was in early late August/early September. But it appears that the increase in night length is equally an important factor towards reducing hunting activity, as much as it is a factor in reducing larval bioluminescence. MD noted that larvae occasionally returned to feed on prey, sometimes after having become dormant for more than 24 hours after feeding and even when being at some distance from the kill. L3, 5, 7 and 8 all did this at various times, returning to finish off what was left, and often disappearing entirely inside the remains of the snail shell. Glow Worm larvae, must also be opportunitic feeders, something which would account for several larvae observed feeding on the same prey, noted before all MD's larvae were separated. Another interesting aspect of feeding behaviour recorded by MD, was the dragging of prey items under cover. L3 and 5 both clearly exhibited this, with L5 visibly moving a 75mm bark chip some 10mm in the process on 24/11/12. We have also recorded wild larvae moving prey on two occasions, but L1 and 2, would also move prey to a more safer environment before consuming it in captivity. |
||
| .. |
| 3.4 ... Recorded larval growth
rates during Project 1: Phase 1. 2012 In order to monitor any growth, all larvae were measured at suitable (monthly) intervals to record their relative sizes throughout the period of captive observations (September-December 2012). Larvae were measured lengthwise in a manner we have used for several years, while the larvae were flat to the surface (or hand) they were on. The first opportunity to carry this out, was when the larvae were initially separated and set up in early September. Subsequent measuring then usually took place during habitat maintenance in October, November and December 2012. |
||||||||||||||||||||||||||||||||||||||||||||||||||||||||||||||||||||||||||||||||||||||||||||||||||||||||||||||||||||||||||||||||||||
| . | ||||||||||||||||||||||||||||||||||||||||||||||||||||||||||||||||||||||||||||||||||||||||||||||||||||||||||||||||||||||||||||||||||||
|
||||||||||||||||||||||||||||||||||||||||||||||||||||||||||||||||||||||||||||||||||||||||||||||||||||||||||||||||||||||||||||||||||||
| . | ||||||||||||||||||||||||||||||||||||||||||||||||||||||||||||||||||||||||||||||||||||||||||||||||||||||||||||||||||||||||||||||||||||
| In the
accompanying table, the variation in larval length
between September and December, is shown in the bottom
row. Some quite stark changes in larval sizes were
observed, with a peak in feeding during September,
obviously attributing to some of the increase in size.
This shows that surprisingly, L6, 8, 9 and 10, all ended
2012, smaller than they were in September. MD found larval shrinkage and size reduction alarming initially. However, it became clear that individual larvae could increase or decrease in size, markedly over short periods of just a few days following feeding. This was probably attributed to larvae rapidly taking on water during feeding. Some may be down to measuring difficulties where the larva was less inclined to 'open up' during dormancy, although it was clear that some larvae had lost significant body mass from the start of the season. Larval size will need to be monitored more closely during the 2013 phase of this research project. Only two larvae moulted their skins whilst in captivity. L11 moulted on the 17/09/12 (within 24 hours) and became active again shortly after and L8 eventually completed it's moult on the 20/09/12, after having remained dormant for much of its time after being transferred to its own container. |
||||||||||||||||||||||||||||||||||||||||||||||||||||||||||||||||||||||||||||||||||||||||||||||||||||||||||||||||||||||||||||||||||||
| .. | ||||
| 3.5 ... Larval bioluminescence as
a direct response to external physical influences The direct reaction exhibited by some invertebrates to sound, is a relatively well known phenomenon and perhaps the best example is that displayed by moths avoiding capture from Bats. Moths are able to detect the echo location produced by Bats and react accordingly by literally dropping out of the air to avoid capture. The possibility that Glow Worm larvae may exhibit some reaction to sound or vibration in the form of bioluminescence, was something that had interested us and the following results and findings have been brought together from both current research projects. Before proceeding further, it is perhaps worth listing the most typical forms of external physical influences we employed to try and trigger a direct response. Under a captive environment, external physical influences could be attributed to the following list
Our observations of larvae kept in captivity, produced only limited direct reactions to external physical influences. All physical influences tended to have a negative effect on larval bioluminescence, or movement displayed by an actively hunting larva, when both regular bioluminescence and movement would temporarily cease, before quickly resuming again. However, we did find that physical influences would initate a positive response from a feeding larva, already producing the faint bioluminescence typical of feeding glows. In these cases, it was found that larval reaction would consist of a sudden increase in brightness for a short period of time, before the level of bioluminescence gradually decreased to become just visible to the naked eye. A positive reaction to sudden (sometimes accidental) knocks on the container was also recorded from larvae which were dormant or inactive (post-feeding) at the time, but these were found to be occasional and with no reliable expectancy. Under field conditions, external physical influences could be attributed to
Although all larvae will glow for a period when directly handled, our observations showed completely negative responses to any of the listed physical influences in the wild. In the field, physical interaction either had a direct negative effect, or failed to promote any bioluminescent response when purposefully looked or tested for. If Glow Worm larvae were to show any form of bioluminescent response or reaction to vibration, then we believed that a vehicle moving just a metre away from vegetation known to contain larvae, would trigger and confirm any larval response. But despite numerous attempts, with one observer walking directly behind a vehicle travelling along forest tracks, we found no evidence to suggest that even the vibration from motor vehicles would trigger any form of bioluminescent response. Cessation of long duration larval bioluminescence was regularly recorded when attempting to locate stationary larvae glowing on plant stems or leaf litter, for the purpose of capturing them to measure their size. Bioluminescence was found to cease almost immediately vegetation close to larvae was disturbed, or especially when the actual stem the larva was on at the time was touched or knocked. Sudden bright light from a hand held torch used during the latter stages of larval location in the field, would also act as the trigger for any larval bioluminescence to stop. 3.6 ... Bioluminescent interaction between Glow Worm larvae and other invertebrates After collecting the first of the nine larvae to be used in our captive research, they remained temporarily housed for several days in a clear plastic, rectangular container with dimensions of 20cm x 15cm. These larvae later became the nine used by MD in his controlled observational research. At night, they were watched collectively for signs of any obvious larval interaction on meeting, but despite much activity from several larvae at any one time, we recorded no bioluminescent glows or any series of glows that could be attributed to direct larval interaction upon two larvae making contact. Finding larvae glowing in close proximity to adult females in the wild, had prompted the question of whether larvae were habitually attracted to the bioluminescence emitted by adult female Glow Worms. This was something that we had wanted to test in captivity, so we took the opportunity to trial this by using an artificial lure designed and constructed by MD, which had proved extremely successful in attracting adult males during trials at Sherwood Forest in 2011. The lure was placed in the container, to see if it would successfully initiate any form of larval response, but returned results all proved negative and we observed no evidence to suggest that there was any larval attraction to bioluminescence, and that larvae observed glowing in close proximity to adult females in the wild, had been purely coincidental. Research on the bioluminescent reactions produced by larvae when coming into contact with other invertebrates was more successful. We had proposed to conduct some trial experiments using L1 and L2, but these never took place as we felt that enough evidence had been obtained from wild larvae as part of Project 2: Phase 1. 2012 based in Sherwood Forest. Between August and October 2012, we recorded a total of nine instances where wild larvae were found glowing within approximately 1.00cm of other invertebrates. Bioluminescence from the stationary larvae, suggested that both parties had just come into immediate contact and that the larval bioluminescence was clearly a responsive and/or a defensive reaction to the encounter. Among the selection of invertebrates were two predatory species. The very common Wolf Spider Pardosa amentata (Lycosidae) was recorded with (but not attacking) larvae on two occasions and the small Ground Beetle Notiophilus biguttatus (Carabidae) once. Invertebrates offering no threat, but appearing to initiate a bioluminescent reaction, were the Common Rough Woodlouse Porcellio scaber (Porcellionidae), Common Shiny Woodlouse Oniscus asellus (Oniscidae) and the Pill Millipede Glomeris marginata (Glomeridae) which was recorded on four occasions. |
| .. | |||||||||||
 |
|
||||||||||
| 4.0 ... The decline in larval
activity prior to over-wintering The larvae under the careful observation of MD, showed a further decline in activity towards the end of November, with individual larvae remaining dormant for extended periods as diapause commenced. The smaller larvae (L9, 10 & 11) showed a tendency to seek out cracks and crevices in the soil substrate and remained well out of sight. As an example, L11 disappeared on 27/11/12 for a total of 26 days, after having crawled 30mm down the side of a gap between the stick and the soil substrate. L9 and 10 were often to be located deep within Sphagnum moss on the substrate surface, or in the grass root stocks. The larger larvae (L3, 4, 5, 6, 7 & 8) more frequently choose to remain under the bark, either on the substrate, but most often hanging upside down from the bark. The decrease and eventual cesation of larval activity shown by MD's larvae, coincided nicely with the inactivity of L1 and 2 with TDP. L1 and 2 also spent most of the time immobile and clinging upside down under moss or loose stones. Both tended to remain inactive, although occasional movements, characterised by either larva transferring from under one stone to another, were noted regularly until late December. In late October, the internal temperature of MD's unheated room fell to reach a night-time low of just 3.5°C. In order to see if a rise in temperature would bring some of the larvae out of hibernation, L3, 4, 5 and 6 were moved to a heated part of the house on 08/11/12. The rest of the larvae remained in the unheated room, provided the temperature did not dip below zero. With an average night-time temperature not lower than 14°C, there was an increase in larval activity from the larvae that were moved the following week. L3 was observed actively hunting, glowing and killing a snail on 09/11/12 with L4, 5, and 6 also active around the same time. L6 was recorded attacking a Snail, but never managed to actually kill it. Despite the increase in temperature, within a week, all four larvae were dormant again, and showed little difference in activity to the larvae remaining in the unheated area of the house. The choice of location for diapause shown by captive larvae, leads us to believe that similar sites would be chosen in the wild, depending on the site. At our Sherwood Forest study site, we believe that larvae simply retreat under stones, moss, within leaf litter and deep within grass tussocks and probably rarely remain in one place all Winter, moving when mild conditions allow. |
||
| . | ||
| 5.0 ... Proposed research work for
Project 1: Phase 2. 2013 Phase 2 of our research will see the continuation of work started as part of Phase 1. As these projects tend to throw up potentially new avenues of research (as did Project 1: Phase 1. 2012) it is always difficult to be able to know exactly where our research will take us. However, the following basic points, are certainly among our list of research priorities for 2013.
|
||
| Please
quote the following when referencing this document Pendleton, T.A.. Pendleton, D.T. and Dale, M.G. "Some notes and observations on the bioluminescence exhibited by the larva of the Glow Worm (Lampyris noctiluca) in captivity" www.eakringbirds.com; December 2012. |
||
| Glow Worm larvae research | ||
| Beetles | ||
| Homepage | ||