
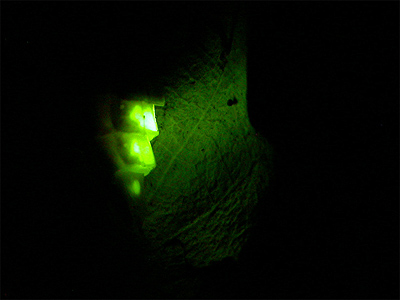
| Glow Worms - a detailed summary 2014 |
| 2014 Glow Worm sightings |
| Clipstone Old Quarter female Glow Worm data 2014 |
| A comparison of Glow Worm colonies at Clipstone Old Quarter and Great Orme in 2014 |
| 2014 marked our sixth year of
studying Nottinghamshire's largest Glow Worm colony. It
eventually turned out to be an excellent year, although
there were problematic issues with timber harvesting and
extraction by the Forestry Commission and the Dukeries
Car Rally. Our disagreement regarding much of how Sherwood Forest is managed is well known and not liked by some. Outspoken we may be, but what we argue the corner for, is always based on facts and facts which we take an enormous amount of time to gather. This year's review begins with the latest on the status of the Glow Worm in Nottinghamshire, the damaging preparations for this year's Dukeries Car Rally, but also report some very welcome news. The results and data from this years surveys of both adults and larvae are detailed, before giving a short overview of 2014 and look ahead to the prospects for 2015. |
 |
| The Glow Worm in Nottinghamshire - a
brief overview Despite still being described by some authorities as common, evidence we have gathered through our own surveying and monitoring of Nottinghamshire's Glow Worm colonies since 2008, shows that the Glow Worm is clearly in a serious decline. However, the decline is still denied by many and having no conservation status doesn't help matters, effectively meaning that site managers, owners and conservation organisations do not have to take any measures to protect Glow Worms on their sites. Yet many do, realising that the Glow Worm presents them with a great public relation, or engagement opportunity. The total number of sites in Nottinghamshire where the Glow Worm survives, is currently down to just 19, effectively disappearing from most of its 49 known Nottinghamshire sites. Clumber Park, Sherwood Forest and Sherwood Pines, are now the best areas in the county to see Glow Worms, but they are decreasing at an alarming rate, even at particular sites within these strongholds. |
| .. | ||
 |
 |
|
| .. | ||
| In 2008 we
recorded well over 200 females at nearby Sherwood Heath
SSSI on two occasions, but numbers have continued to drop
dramatically since then, producing just single females
for several years and two females this year on May 26th
2014. The decline in Glow Worm numbers over a short period of time at Sherwood Heath has been dramatic and we strongly believe (that what could well be a natural decline) is certainly being accelerated by present site management carried out under the instructions of Natural England. Sherwood Heath has now become much drier, influenced by an over zealous tree/scrub clearance programme and Bracken control (the long term removal of Bracken via rolling and herbicidal spraying) both carried out by heavy machinery. Glow Worm populations on lowland heath are clearly more prone to climatic changes than those within wooded areas, where moisture is retained within the soil for longer through shade. |
||
| .. |
 |
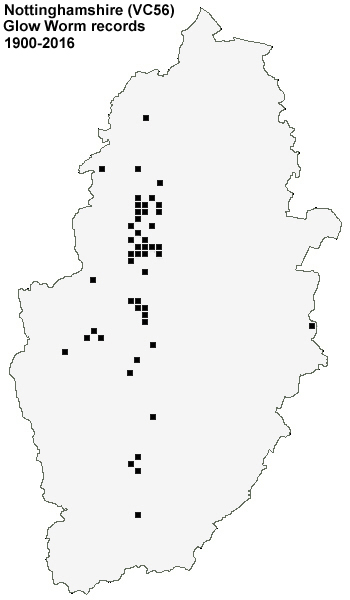
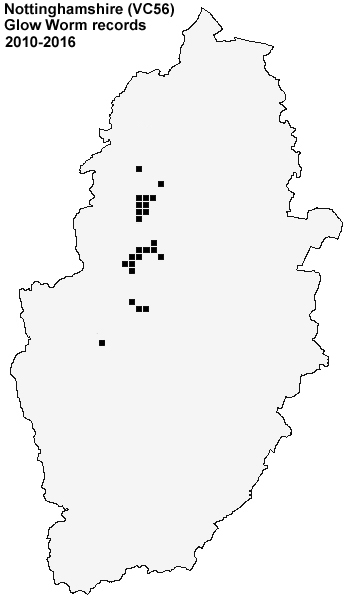
For some reason, Natural
England believe that Glow Worms are actually increasing
at Clipstone Old Quarter and they have no interest at all
in taking simple measures to help conserve them. Admittedly, the Glow Worm population has little direct correllation with dead wood (Saproxylic) invertebrates and ancient woodland, for which Sherwood Forest attained its NNR status. But if one species is not doing well, then others are certainly suffering similarly and it should not matter whether these are common (expendable?) or not. The whole idea of conservation is surely to conserve all, rather than cherry pick targetted species. So contrary to what Natural England and others may think, we have produced two maps showing the Glow Worm's Nottinghamshire distribution between 1900 and 1999 and 2000-2013. Make your own mind up as to whether the Glow Worm is as common now as it once used to be. |
|
| .. | ||
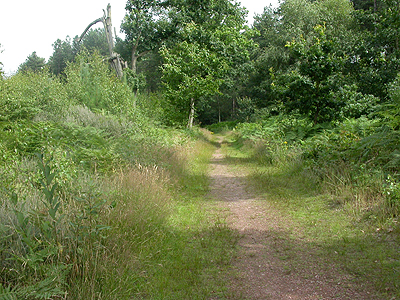
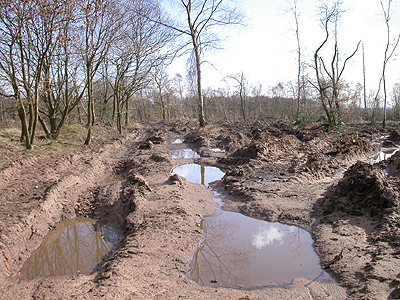
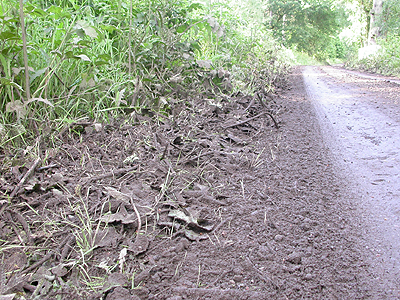
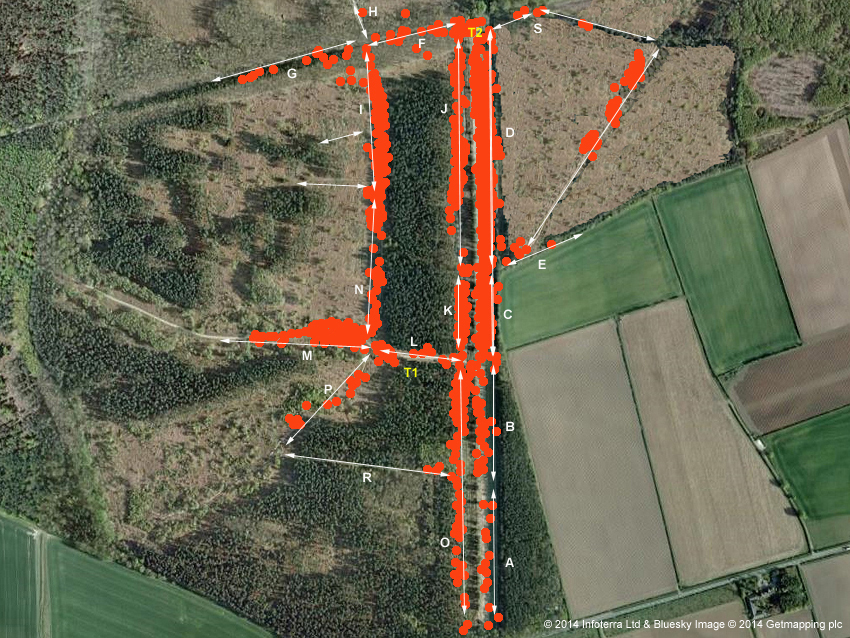
| The
effects of felling, timber extraction and the Dukeries
Car Rally The season wasn't without problems, with the harvesting of Pines by the Forestry Commission in one area of the recording site, really proving to be detrimental to the number of female Glow Worms eventually along two recording sections (E and S). The above photograph shows section S, as it looked in Summer 2013. It wasn't so much the felling that caused the damage, but the heavy machinery used during inconsiderate timber extraction, which made the felled area and the track along section S, resemble the aftermath of the Somme (below right) in March 2014. |
||
| .. | ||
| Despite this, some female
Glow Worms did survive and now the work is finished in
that area, numbers should hopefully increase in sections
E and S over the next few years. However, more felling
and extraction is to take place during the Winter of
2014/15, along with work to reinstate some tracks to
their previous width, by removing vegetation. This of course will again prove to be detrimental to the number of Glow Worms appearing next year, but we decided not to intervene by collecting and moving Glow Worm larvae during the Autumn, as this would artificially affect the number of Glow Worms in the areas where they would have been relocated to during 2015 or 2016. By not interfering, we will be able to show through further research, how damaging commercial forestry is to wildlife, especially to those species unable to move long distances and recolonise. Monitoring the numbers of larvae here during the late Summer and Autumn months of previous years, gave us an indication what the following year's adult population would be and proved invaluable before the felling operations in sections E and S. |
 |
|
| .. | ||
| The good
number of larvae found along section S in Autumn 2013,
proved to be virtually wiped out by the felling/timber
extraction process and only six females made it to
maturity, when the number of female larvae was known to
have been much higher before the work took place. Although the felling is necessary to the eventual restoration of the site back to heathland/woodland, it will change the site and affect its microclimate. The Pines create shade, help to maintain higher levels of moisture and act as a wind-break. Removing them opens up the site, exposes it and dries it out, effects we have seen at the nearby Sherwood Heath SSSI. So over the next few decades (or possibly sooner) the number of Glow Worms in some sections of Clipstone Old Quarter, is likely to reduce. Any reduction in numbers will likely lead to additional colony fragmentation, which has already happened across the Sherwood Forest area. Despite a seemingly abundance of suitable habitat, Glow Worms occur within Sherwood Forest (away from Clipstone Old Quarter and Sherwood Heath SSSI) as small fragmented colonies at SK613682, SK627688, SK635684 and at SK598665. This latter location is near to the Clipstone Old Quarter colony but not part of it (at least not now) and will make an interesting additional study, being along the edge of Pine woodland, directly bordering onto agricultural farmland. We only found a single female in 2014 and very late in the season, so we intend to make regular visits to this site in 2015, to gain some idea of numbers and colony size. |
||
| .. |
| There was some good news during 2014, when the organisers of the Dukeries Car Rally decided to stop running the rally through parts of the Sherwood Forest NNR and Clipstone Old Quarter in early June. | ||
| .. | ||
| The Mansfield Chad
Newspaper covered the story, quoting that "after
discussions with the Forestry Commission and due to
increasing leisure and environmental pressures, rallying
in the Sherwood Forest area will now be restricted to the
Autumn and Winter months". This is all many of
us wanted from the start. The Newspaper also went on to
specifically cite breeding Birds and Glow Worms as being
two of the reasons for the decision. Hopefully now, there will be no repeat of this years destruction to the track edges, as there was on the eve of this year's rally. The flattening of trackside vegetation (and three developing Glow Worm pupae we were monitoring) by heavy plant machinery, along the lengths of sections K, J and most of L, were deliberate. Some simple detective work proved that a machine whith an eight foot wheel-base, went down a 12 foot wide track with tyre marks running completely down the centre of the track and on the adjacent verges. Whatever machinery it was, went down the track one way, then returned up the other side in precisely the same manner, ensuring vegetation was crushed on either side of the track. It was completely unnecessary and destructive. |
 |
|
| .. | ||
| Overview
of the 2014 Clipstone Old Quarter survey results and data Visits to the Clipstone Old Quarter area of Sherwood Forest on 116 consectutive days and nights between early March and late July 2014, constituted our sixth consectutive year studying one of the UK's most substantial Glow Worm colonies. A final total of 742 females, recorded between May 18th and July 24th, was enough to represent the second highest total since 2009, falling just 50 females short of the total attained in 2011. |
| .. | ||||||||||||||||||||||||||||||||||||
|
The 2014 glowing season
was very early, beginning with Female 001 appearing in
section A on May 18th. The number of females quickly rose to a site record of 101 (virtually all in the grass sections of A, B, C and D) by May 29th, which was largely caused by the complete absence of males until this date. An unprecedented mass emergence of males took place and after a count of 99 females on May 30th, there were just 13 females by the following night. This helped to mark the (variable) early peak in numbers, which has been recorded here on many occasions, although not always immediately obvious in the graphs which follow. |
|||||||||||||||||||||||||||||||||||
| .. | ||||||||||||||||||||||||||||||||||||
| Although the percentage of 'one night' females (corresponding to peak numbers of males), was not the highest we have ever recorded before (or even in 2014) the pronounced appearance of the early peak this year, was really quite exceptional and shows well in the first of the graphs showing female/male counts dating back to 2009. The graph also shows that, apart from a few late females, the season was virtually over by the middle of July. The last female was not seen after July 25th, which proved to be two days earlier than in 2013. We have included all the graphs from previous years, as they help illustrate the variances in the glowing season from year to year. | ||||||||||||||||||||||||||||||||||||
| .. | ||||||||||||||||||||||||||||||||||||
 |
||
 |
||
 |
||
 |
||
 |
||
 |
||
| .. |
|
The pronounced early peak
in numbers, again preceded the traditional main (lower)
peak of 60 females reached a few weeks later. Both peaks
were reached earlier than in previous years, with the
main peak coming at the end of June, rather than around
the middle of July. Female Glow Worms appearing in the grass sections of A, B, C and D, were found to make up an astonishing 82.00% of the 101 females present on May 29th, with the remaining 18.00% being found along the forest tracks and paths in six (E, I, L, M, O and P) of the other 14 survey sections. When we look at the percentages found on the main peak date of July 2nd, those females in A, B, C and D, made up just 30%, with 70% of females being present in 11 of the 14 other survey sections. In effect, habitat seemed to affect larva to adult development, creating two distinct glowing seasons within the same population this year, not something we have noted in previous years. The early appearance of large numbers of females in grass was surprising, more so when considering that the ground level temperature of grass was always found to be lower than the forest tracks. On one night, the grass temperature was even recorded to have dropped as low as 3°C, but this was quite exceptional. Moisture in the form of dew, affected the number of females glowing and when there was already a heavy dew forming under clear skies at the onset of our evening surveying, females would rarely glow in the grass sections of A, B, C and D. |
|||||||||||||||||||||||||||||||||||||||||||||||||||||||||||||||||||||
| .. | ||||||||||||||||||||||||||||||||||||||||||||||||||||||||||||||||||||||
| We measure
the number of males present on site, by totalling the
number of females glowing for just one night, when
analysing the data prior to writing this review in
November. Females glowing for just one night, are presumed to have mated successfully. We do not take into account the chances of predation, though believe this to be likely at times. Assuming males mate with only one female during a single night (based on evidence we have found) then the higher the percentage in column four, correllates to a high number of males. From May 30th, the number of males remained high and relatively constant until around June 25th, when the percentages in column four of Table 02 suddenly dropp from 64.00% down to 28.00%. A lower number of males is shown by the increase in the consecutive dates/nights when each female glows. Numbering and using plastic plant labels to mark the location of each female, is a method we have used successfully since 2010. Females have been found to rarely move any distance from night to night, although those females glowing along survey sections with a large amount of tree canopy cover (F and G), will occassionally move to a more open aspect in order to light up, before returning to a safe place during daylight hours. Weekly counts of new female Glow Worms in survey sections A - S during 2014 The differences within the number and peak dates of new female Glow Worms appearing in survey sections of different habitat, is well illustrated in the following graphs produced for all 18 survey sections. These differences show particularly well in sections D (grass) and J (forest track). While there were large number of females appearing in D, hardly any new females were recorded in J at the same time. Emergences of new females in these sections were later reversed in the second week of June. |
||
| .... | ||
 |
 |
|
 |
 |
|
 |
 |
|
 |
 |
|
 |
 |
|
 |
 |
|
 |
 |
|
 |
 |
|
 |
 |
|
| .... | ||
| It can also
be noted that some survey sections produced very poor
results in 2014. The most affected sections were H, R and
S. Although section E suffered tremendous damage through
felling and timber extraction, enough females survived in
three small areas of deciduous trees where no forestry
operations took place, to show an increase in numbers
after a poor year in 2013. We mentioned the affects of felling and timber extraction in section S earlier, but Glow Worm numbers in section H (and to a lesser extent section G) were affected by the stacking of logs over a large area. Preparation work for future felling and extraction, were responsible for low numbers in R. The peak dates of merging females, varies with each survey section over the course of the season. The results from section M are interesting, as peak numbers here, occurred during the first week of June. |
||
| .... |
| Table 03. ... Female Glow Worm counts per survey section 2010-2014 | ||
| .... | ||
| I = Population increased .. D = Population decreased .. tGW = Total females recorded during the year | ||
| .... |
| .. | 2010 .. tGW = 502 | .. | 2011.. tGW = 792 | .. | 2012.. tGW = 599 | .. | 2013.. tGW = 495 | 2014.. tGW = 742 | |||||||
| Section | .. | Count/Total | Percentage | .. | Count/Total | Percentage | .. | Count/Total | Percentage | .. | Count/Total | Percentage | .. | Count/Total | Percentage |
| A | .. | 017/502 | 03.38% | .. | 032/792 | 04.04%0I | .. | 036/599 | 06.01%0I | .. | 013/495 | 02.62%0D | .. | 015/742 | 02.02%0D |
| B | .. | 034/502 | 06.77% | .. | 046/792 | 05.80%0D | .. | 041/599 | 06.84%0I | .. | 033/495 | 06.66%0D | .. | 027/742 | 03.64%0D |
| C | .. | 019/502 | 03.78% | .. | 019/792 | 02.39%0D | .. | 029/599 | 04.84%0I | .. | 027/495 | 05.45%0I | .. | 049/742 | 06.61%0I |
| D | .. | 095/502 | 18.92% | .. | 212/792 | 26.76%0I | .. | 157/599 | 26.21%0D | .. | 139/495 | 28.00%0I | .. | 149/742 | 20.10%0D |
| E | .. | 000/502 | 00.00% | .. | 019/792 | 02.39%0I | .. | 053/599 | 08.84%0I | .. | 023/495 | 04.64%0D | .. | 040/742 | 05.39%0I |
| F | .. | 023/502 | 04.58% | .. | 030/792 | 03.78%0D | .. | 011/599 | 01.83%0D | .. | 003/495 | 00.60%0D | .. | 017/742 | 02.29%0I |
| G | .. | 010/502 | 01.99% | .. | 023/792 | 02.90%0I | .. | 024/599 | 04.00%0I | .. | 001/495 | 00.20%0D | .. | 016/742 | 02.15%0I |
| H | .. | 001/502 | 00.19% | .. | 003/792 | 00.37%0I | .. | 009/599 | 01.50%0I | .. | 003/495 | 00.60%0D | .. | 001/742 | 00.13%0D |
| I | .. | 016/502 | 03.18% | .. | 047/792 | 05.93%0I | .. | 052/599 | 08.68%0I | .. | 012/495 | 02.42%0D | .. | 059/742 | 07.96%0I |
| J | .. | 107/502 | 21.31% | .. | 110/792 | 13.88%0D | .. | 046/599 | 07.67%0D | .. | 103/495 | 20.80%0I | .. | 102/742 | 13.76%0D |
| K | .. | 035/502 | 06.97% | .. | 046/792 | 05.80%0D | .. | 005/599 | 00.83%0D | .. | 026/495 | 05.25%0I | .. | 038/742 | 05.12%0D |
| L | .. | 037/502 | 07.37% | .. | 015/792 | 01.89%0D | .. | 003/599 | 00.50%0D | .. | 016/495 | 03.23%0D | .. | 019/742 | 02.56%0D |
| M | .. | 022/502 | 04.38% | .. | 046/792 | 05.80%0I | .. | 032/599 | 05.34%0D | .. | 011/495 | 02.22%0D | .. | 051/742 | 06.88%0I |
| N | .. | 033/502 | 06.57% | .. | 059/792 | 07.44%0I | .. | 040/599 | 06.67%0D | .. | 030/495 | 06.06%0D | .. | 070/742 | 09.44%0I |
| O | .. | 045/502 | 08.96% | .. | 059/792 | 07.44%0D | .. | 044/599 | 07.34%0D | .. | 037/495 | 07.47%0I | .. | 063/742 | 08.50%0I |
| P | .. | 006/502 | 01.19% | .. | 003/792 | 00.37%0D | .. | 016/599 | 02.67%0I | .. | 001/495 | 00.20%0D | .. | 020/742 | 02.69%0I |
| R | .. | 004/502 | 00.79% | .. | 022/792 | 02.77%0I | .. | 012/599 | 02.00%0D | .. | 015/495 | 03.03%0I | .. | 004/742 | 00.53%0D |
| S | .. | 000/502 | 00.00% | .. | 000/792 | 00.00%0- | .. | 015/599 | 02.50%0I | .. | 002/495 | 00.40%0D | .. | 006/742 | 00.80%0I |
| . | . | . | . | . | . | . | . | . | . | . | . | . | . | . | . |
| I/D Ratio | . | . | . | . | . | I/9.. D/8 | . | . | I/9.. D/9 | . | . | I/6.. D/12 | . | . | I/10.. D/8 |
| ..... | ||
| Table 03 shows the number of female Glow Worms found in all survey sections since 2010. The percentage of each year's total is shown in the percentage column, along with a letter indicating an increase or decrease in numbers from the previous year. Only section L has shown a continuous decrease in the population percentage. Even though the number of females present in section L may have increased on some previous years, the actual number of females is still 50% down on what it was in 2010. | ||
| ..... | ||
 |
||
| ..... |
| Section J has
proved to have the most consistant population of females,
although 2012 represented a poor year. Female counts have
just been over 100 in four of the five years shown in
Table 03. However, the lower half of section J provided
only a handful of females in 2014. We did expect more,
but had found very few glowing larvae along here the
previous Autumn and one during the early Spring. Female longevity Five females remained un-mated and proved to be 'long glowers' during 2014. These are not the longest lived females we have had in previous years, but over the course of this year, these ended up being the most notable. After first appearing on June 16th, F385 (21 days) then missed the next five nights, before glowing on 14 out of a further 15 nights. F482 (22 days) glowed for four nights, missed five nights, but then glowed each night apart from nights 13 and 20. F553 (23 days) only missed the 6th and 13th nights. F603 (20 days) had glowed consistantly for 11 nights, but then glowed on only two more nights out of the next nine. And finally, F621 (23 days) only missed the 3rd and 6th nights. As the glowing season drew to its early end, the last new females to emerge were F738, F739 and F740 on July 10th, F741 on July 14th and F742 on July 17th, which eventually became the last female we recorded glowing on July 24th. |
||
| Early Spring 2014 larval survey results and data | ||||||||||||||||||||||||||||||||||||||||||||||||||||||||||||||||||||||||||||||||||||||||||||||||||||||||||||||||||||||||||||||||
| ..... | ||||||||||||||||||||||||||||||||||||||||||||||||||||||||||||||||||||||||||||||||||||||||||||||||||||||||||||||||||||||||||||||||
| Over the preceding mild
Winter, we had conducted several nocturnal surveys on
nights when the temperature was above 8°C, but did not
record any larvae. Larvae became active diurnally in sections A, B, C and D, from the early date of March 8th onwards, although activity was irregular until the last week of March. All larvae found during daylight in the survey sections, are believed to be pre-pupation larvae. |
|
|||||||||||||||||||||||||||||||||||||||||||||||||||||||||||||||||||||||||||||||||||||||||||||||||||||||||||||||||||||||||||||||
| ..... | ||||||||||||||||||||||||||||||||||||||||||||||||||||||||||||||||||||||||||||||||||||||||||||||||||||||||||||||||||||||||||||||||
| Glow
Worm larval size averages 2009 - 2014 The left hand column of Table 04, shows the break down of weekly periods each Spring. Reading the size data down each year's column, shows how larval growth increases before pupation. Not shown in the 2014 column, is the data from five larvae found during the week March 8-13th 2014. The five larvae measured, produced an average of 16.00mm and a single larva found on March 17th, measured 17.00mm. It is interesting to note how the total average larval size for each Spring period has decreased since 2009, based on the data we have. Overall, there has been a variation in larval size of 2.69mm (from 2009-2014) with an average of 20.32mm, based on size data obtained from 771 larvae. This year's graph showing the four categories of larval sizes found in sections A, B, C and D, as recorded during Spring 2014, is shown below. |
||||||||||||||||||||||||||||||||||||||||||||||||||||||||||||||||||||||||||||||||||||||||||||||||||||||||||||||||||||||||||||||||
| ..... | ||||||||||||||||||||||||||||||||||||||||||||||||||||||||||||||||||||||||||||||||||||||||||||||||||||||||||||||||||||||||||||||||
 |
Most larvae would be
expected to become adults during the late Spring and
Summer months. This is based on the six out of seven larvae measuring between 15mm and 18mm, that were taken into captivity during Spring 2013. The six that pupated, had all emerged as adult males by mid-June 2013. The remaining larva is still in captivity as of November 2014. |
| ..... | ||
| If we break the 2014 larval size data down further, it becomes evident how the percentage of larvae in the larger size range increase through April and May. The percentage of 9mm-15mm larvae is actually lower than we have found in previous years. | ||
| ..... |
| Diurnal Glow Worm larval size ranges found during March 2014 | ||||||||||||||||||||||||
| .. | ||||||||||||||||||||||||
| 9mm-15mm larval size range | Intermediate | 19mm-28mm larval size range | ||||||||||||||||||||||
| Section | .. | 9mm | 10mm | 11mm | 12mm | 13mm | 14mm | 15mm | .. | 16mm | 17mm | 18mm | .. | 19mm | 20mm | 21mm | 22mm | 23mm | 24mm | 25mm | 26mm | 27mm | 28mm | |
| A | .. | .. | .. | .. | .. | .. | 1 | 1 | .. | .. | 1 | .. | .. | .. | 1 | .. | .. | .. | .. | .. | .. | .. | .. | |
| B | .. | .. | .. | .. | .. | .. | .. | .. | .. | .. | .. | .. | .. | .. | .. | .. | .. | .. | .. | .. | .. | .. | .. | |
| C | .. | .. | .. | .. | .. | .. | .. | .. | .. | .. | .. | .. | .. | .. | .. | .. | .. | .. | .. | .. | .. | .. | .. | |
| D | .. | .. | .. | .. | .. | .. | .. | 3 | .. | 4 | .. | 1 | .. | 1 | 1 | .. | 2 | .. | .. | .. | .. | .. | .. | |
| .. | ||||||||||||||||||||||||
| 9mm-15mm larval size range 31.00% | Intermediate 37.00% | 19mm-28mm larval size range 32.00% | ||||||||||||||||||||||
| Total % | .. | 0.00 | 0.00 | 0.00 | 0.00 | 0.00 | 6.25 | 25.00 | .. | 25.00 | 6.25 | 6.25 | .. | 6.25 | 12.50 | 0.00 | 12.50 | 0.00 | 0.00 | 0.00 | 0.00 | 0.00 | 0.00 | |
| Diurnal Glow Worm larval size ranges found during April 2014 | ||||||||||||||||||||||||
| .. | ||||||||||||||||||||||||
| 9mm-15mm larval size range | Intermediate | 19mm-28mm larval size range | ||||||||||||||||||||||
| Section | .. | 9mm | 10mm | 11mm | 12mm | 13mm | 14mm | 15mm | .. | 16mm | 17mm | 18mm | .. | 19mm | 20mm | 21mm | 22mm | 23mm | 24mm | 25mm | 26mm | 27mm | 28mm | |
| A | .. | .. | .. | .. | .. | 1.. | .. | .. | .. | .. | 3 | 1. | .. | .. | 1 | 1 | .. | 1 | .. | .. | 1 | .. | .. | |
| B | .. | .. | .. | .. | .. | .. | .. | 1 | .. | ..3 | 5 | 1. | .. | 7 | 3 | .. | 1 | 1 | ..2 | 1 | .. | .. | .. | |
| C | .. | .. | .. | .. | .. | .. | .. | .. | .. | .. | 3 | 2 | .. | 3 | 1 | 1 | 2 | 2 | .. | .. | .. | .. | .. | |
| D | .. | .. | .. | .. | .. | .. | 2 | 12 | .. | 7 | 10 | 14 | .. | 6 | 12 | 7 | 6 | 6 | 1 | 4 | 1 | .. | .. | |
| .. | ||||||||||||||||||||||||
| 9mm-15mm larval size range 12.00% | Intermediate 36.00% | 19mm-28mm larval size range 52.00% | ||||||||||||||||||||||
| Total % | .. | 0.00 | 0.00 | 0.00 | 0.00 | 0.73 | 1.47 | 9.55 | .. | 7.35 | 15.44 | 13.23 | .. | 11.76 | 12.50 | 6.61 | 6.61 | 7.35 | 2.20 | 3.67 | 1.47 | 0.00 | 0.00 | |
| Diurnal Glow Worm larval size ranges found during May 2014 | ||||||||||||||||||||||||
| .. | ||||||||||||||||||||||||
| 9mm-15mm larval size range | Intermediate | 19mm-28mm larval size range | ||||||||||||||||||||||
| Section | .. | 9mm | 10mm | 11mm | 12mm | 13mm | 14mm | 15mm | .. | 16mm | 17mm | 18mm | .. | 19mm | 20mm | 21mm | 22mm | 23mm | 24mm | 25mm | 26mm | 27mm | 28mm | |
| A | .. | .. | .. | .. | .. | .. | .. | .. | .. | .. | .. | .. | .. | .. | .. | .. | .. | .. | 1. | .. | .. | .. | .. | |
| B | .. | .. | .. | .. | .. | .. | .. | .. | .. | .. | .. | .. | .. | .. | .. | 1 | 2 | .. | .. | .. | .. | .. | .. | |
| C | .. | .. | .. | .. | .. | .. | .. | .. | .. | 1 | .. | 1 | .. | .. | .. | .. | 1 | .. | 2 | 1 | .. | .. | .. | |
| D | .. | .. | .. | .. | .. | .. | .. | 1 | .. | .. | .. | .. | .. | .. | 2 | 1 | 3 | .. | .. | 3 | .. | .. | .. | |
| .. | ||||||||||||||||||||||||
| 9mm-15mm larval size range 5.00% | Intermediate 10.00% | 19mm-28mm larval size range 85.00% | ||||||||||||||||||||||
| Total % | .. | 0.00 | 0.00 | 0.00 | 0.00 | 0.00 | 0.00 | 5.00 | .. | 5.00 | 0.00 | 5.00 | .. | 0.00 | 10.00 | 10.00 | 30.00 | 0.00 | 15.00 | 20.00 | 0.00 | 0.00 | 0.00 | |
| In 2013, we had recorded a short period of larval bioluminescnce between May 10th and 21st, which were from fully fed, pre-pupating larvae. It was an interesting discovery, made all the more interesting because all the bioluminsecence recorded was of long duration, which could last several minutes. | ||
| .. | ||
| So with the good level of
diurnal larval activity during April 2014, several
(initially unsuccessful) surveys were undertaken after
dark. We had hoped for the commencement of larval
bioluminsecence in early May, but failed to take into
account the early appearance of larvae this year. Our
survey of April 25th produced a total of 12 larvae, found
between 22:30h and 02:00h and with a recorded temperature
of 8°C. Once again, long duration larval bioluminescence
was produced by six of the larvae recorded. It was
interesting to note that larval bioluminescence largely
occurred from 23:56h until 01:41h. Midnight was again the key time when additional nocturnal surveys recorded a single Glow Worm larva on April 26th at 00:01h and two larvae on April 29th at 00:00h and 00:15h. One of these two larvae was already in the process of pupating when found and eventually pupated in captivity (but kept outdoors) on May 14th. The pupation process triggers a great deal of bioluminescence and this continues for several days after pupation and while the pupa is still soft. |
 |
|
| .. | ||
| On May 3rd,
another three larvae were found glowing at 23:44h, 23:47h
and 01:07. In addition to the larvae, a freshly formed
male pupa was found producing strong bioluminescence in
section J. It was checked on consecutive nights and
emerged sometime during the day on May 24th. Other pupae
found during the month included freshly formed female
pupae in section J on May 17th, section K on May 18th,
section E on May 19th, with another in section K on May
26th. Unfortunately, none of these emerged, all being
crushed during preparations for the Dukeries Car Rally. Unusually for May, bioluminescence was noted from hunting larvae, not likely to be adult until 2015. Numerous larvae continued to be found during June, but we recorded very few larvae after early July, around the date we would expect to find larvae. |
||
| ..... | ||
| Nocturnal Glow Worm larval size ranges found during April 2014 | ||||||||||||||||||||||||
| .. | ||||||||||||||||||||||||
| 9mm-15mm larval size range | Intermediate | 19mm-28mm larval size range | ||||||||||||||||||||||
| Section | .. | 9mm | 10mm | 11mm | 12mm | 13mm | 14mm | 15mm | .. | 16mm | 17mm | 18mm | .. | 19mm | 20mm | 21mm | 22mm | 23mm | 24mm | 25mm | 26mm | 27mm | 28mm | |
| D | .. | .. | .. | .. | .. | .. | .. | .. | .. | .. | .. | .. | .. | 1 | .. | 1 | .. | .. | .. | .. | .. | .. | .. | |
| E | .. | .. | .. | .. | .. | .. | .. | .. | .. | .. | .. | .. | .. | .. | .. | .. | .. | .. | .. | .. | .. | .. | .. | |
| F | .. | .. | .. | .. | .. | .. | .. | .. | .. | .. | .. | .. | .. | .. | .. | .. | .. | .. | .. | .. | .. | .. | .. | |
| G | .. | .. | .. | .. | .. | .. | .. | .. | .. | .. | .. | .. | .. | .. | .. | .. | .. | .. | .. | .. | .. | .. | .. | |
| I | .. | .. | .. | .. | .. | .. | .. | .. | .. | .. | .. | .. | .. | .. | .. | .. | .. | .. | .. | .. | .. | .. | .. | |
| J | .. | .. | .. | .. | .. | .. | .. | .. | .. | .. | 1 | 2 | .. | 5 | 3 | 2 | 1 | .. | 2 | .. | 1 | .. | .. | |
| K | .. | .. | .. | .. | .. | .. | .. | .. | .. | .. | .. | .. | .. | .. | .. | .. | .. | .. | .. | .. | .. | .. | .. | |
| L | .. | .. | .. | .. | .. | .. | .. | .. | .. | .. | .. | .. | .. | .. | .. | .. | .. | .. | .. | .. | .. | .. | .. | |
| M | .. | .. | .. | .. | .. | .. | .. | .. | .. | .. | .. | .. | .. | .. | .. | .. | .. | .. | .. | .. | .. | .. | .. | |
| N | .. | .. | .. | .. | .. | .. | .. | .. | .. | .. | .. | .. | .. | .. | .. | .. | .. | .. | .. | .. | .. | .. | .. | |
| O | .. | .. | .. | .. | .. | .. | .. | .. | .. | .. | .. | .. | .. | .. | .. | .. | .. | .. | .. | .. | .. | .. | .. | |
| S | .. | .. | .. | .. | .. | .. | .. | .. | .. | .. | .. | .. | .. | .. | .. | .. | .. | .. | .. | .. | .. | .. | .. | |
| .. | ||||||||||||||||||||||||
| 9mm-15mm larvae size range 00.00% | Intermediate 16.00% | 19mm-28mm larvae size range 84.00% | ||||||||||||||||||||||
| Nocturnal Glow Worm larval size ranges found during May 2014 | ||||||||||||||||||||||||
| .. | ||||||||||||||||||||||||
| 9mm-15mm larval size range | Intermediate | 19mm-28mm larval size range | ||||||||||||||||||||||
| Section | .. | 9mm | 10mm | 11mm | 12mm | 13mm | 14mm | 15mm | .. | 16mm | 17mm | 18mm | .. | 19mm | 20mm | 21mm | 22mm | 23mm | 24mm | 25mm | 26mm | 27mm | 28mm | |
| D | .. | .. | .. | .. | .. | .. | .. | .. | .. | .. | .. | .. | .. | .. | .. | .. | .. | .. | .. | .. | .. | .. | .. | |
| E | .. | .. | .. | .. | .. | .. | .. | .. | .. | .. | .. | .. | .. | .. | .. | .. | .. | .. | .. | .. | .. | .. | .. | |
| F | .. | .. | .. | .. | .. | .. | .. | .. | .. | .. | .. | .. | .. | .. | .. | .. | .. | .. | .. | .. | .. | .. | .. | |
| G | .. | .. | .. | .. | .. | .. | .. | .. | .. | .. | .. | .. | .. | .. | .. | .. | .. | .. | .. | .. | .. | .. | .. | |
| I | .. | .. | .. | .. | 1 | .2 | .. | .. | .. | .. | .. | 1 | .. | .. | .. | .. | .. | .. | .. | .. | .. | .. | .. | |
| J | .. | .. | .. | .. | .. | .. | .. | ..k | .. | 1 | .. | 2 | .. | .. | 1 | .. | .. | .. | .. | .. | .. | .. | .. | |
| K | .. | .. | .. | .. | .. | .. | .. | 1 | .. | .. | .. | .. | .. | 1 | .. | .. | .. | .. | .. | .. | .. | .. | .. | |
| L | .. | .. | .. | .. | .. | .. | .. | .. | .. | .. | .. | .. | .. | .. | .. | 1 | .. | .. | .. | .. | .. | .. | .. | |
| M | .. | .. | .. | .. | .. | .. | .. | .. | .. | .. | .. | .. | .. | .. | .. | .. | .. | .. | .. | .. | .. | .. | .. | |
| N | .. | .. | .. | .. | .. | .. | .. | .. | .. | .. | .. | .. | .. | .. | 2 | .. | .. | .. | .. | .. | .. | .. | .. | |
| O | .. | .. | .. | .. | .. | .. | .. | .. | .. | .. | .. | .. | .. | 1 | .. | .. | .. | .. | .. | .. | .. | .. | .. | |
| S | .. | .. | .. | .. | .. | .. | .. | .. | .. | .. | .. | .. | .. | .. | .. | .. | .. | .. | .. | .. | .. | .. | .. | |
| .. | ||||||||||||||||||||||||
| 9mm-15mm larvae size range 31.00% | Intermediate 31.00% | 19mm-28mm larvae size range 38.00% | ||||||||||||||||||||||
| Nocturnal Glow Worm larval size ranges found during June 2014 | ||||||||||||||||||||||||
| .. | ||||||||||||||||||||||||
| 9mm-15mm larval size range | Intermediate | 19mm-28mm larval size range | ||||||||||||||||||||||
| Section | .. | 9mm | 10mm | 11mm | 12mm | 13mm | 14mm | 15mm | .. | 16mm | 17mm | 18mm | .. | 19mm | 20mm | 21mm | 22mm | 23mm | 24mm | 25mm | 26mm | 27mm | 28mm | |
| D | .. | .. | .. | .. | .. | .. | .. | .. | .. | .. | .. | 1 | .. | .. | .. | .. | .. | .. | .. | .. | .. | .. | .. | |
| E | .. | .. | .. | .. | .. | .. | .. | .. | .. | .. | .. | .1 | .. | .. | .. | .. | .. | .. | .. | .. | .. | .. | .. | |
| F | .. | .. | .. | .. | .. | .. | .. | .. | .. | .. | .. | .. | .. | .. | .. | .. | .. | .. | .. | .. | .. | .. | .. | |
| G | .. | .. | .. | .. | .. | .. | .. | .. | .. | .. | .. | .. | .. | .. | .. | .. | .. | .. | .. | .. | .. | .. | .. | |
| I | .. | .. | .. | .. | .1 | .4 | .2 | .1 | .. | .1 | .1 | .. | .. | .. | 1 | .. | .. | 1 | .. | .. | .. | .. | .. | |
| J | .. | .. | .. | .. | .. | .. | .. | ..k | .. | .. | .. | .. | .. | .. | 1 | .. | .. | .. | .. | .. | .. | .. | .. | |
| K | .. | .. | .. | .. | .. | .. | .. | .. | .. | .. | .. | .. | .. | .. | .. | .. | .. | .. | .. | .. | .. | .. | .. | |
| L | .. | .. | .. | .. | .. | .. | .. | .. | .. | .. | .. | .. | .. | .. | .. | .. | .. | .. | .. | .. | .. | .. | .. | |
| M | .. | .. | .. | .. | .1 | 1 | .. | .. | .. | .. | 1 | .. | .. | .. | .1 | .. | .. | .. | .. | .. | .. | .. | .. | |
| N | .. | .. | .. | .. | .. | .. | .. | .. | .. | .. | .. | .. | .. | .. | .1 | .. | .. | .. | .. | .. | .. | .. | .. | |
| O | .. | .. | .. | .. | .. | .. | .. | 1 | .. | .. | .. | .1 | .. | .. | .. | .. | .. | .. | .. | .. | .. | .. | .. | |
| S | .. | .. | .. | .. | .. | .. | .. | .. | .. | .. | .. | .. | .. | .. | .. | .. | .. | .. | .. | .. | .. | .. | .. | |
| .. | ||||||||||||||||||||||||
| 9mm-15mm larvae size range 44.00% | Intermediate 27.00% | 19mm-28mm larvae size range 29.00% | ||||||||||||||||||||||
| Nocturnal Glow Worm larval size ranges found during July 2014 | ||||||||||||||||||||||||
| .. | ||||||||||||||||||||||||
| 9mm-15mm larval size ranges | Intermediate | 19mm-28mm larval size ranges | ||||||||||||||||||||||
| Section | .. | 9mm | 10mm | 11mm | 12mm | 13mm | 14mm | 15mm | .. | 16mm | 17mm | 18mm | .. | 19mm | 20mm | 21mm | 22mm | 23mm | 24mm | 25mm | 26mm | 27mm | 28mm | |
| D | .. | .. | .. | .. | .. | .. | .. | .. | .. | .. | .. | .. | .. | .. | .. | .. | .. | .. | .. | .. | .. | .. | .. | |
| E | .. | .. | .. | .. | .. | .. | .. | .. | .. | .. | .. | . | .. | .. | .. | .. | .. | .. | .. | .. | .. | .. | .. | |
| F | .. | .. | .. | .. | .. | .. | .. | .. | .. | .. | .. | .. | .. | .. | .. | .. | .. | .. | .. | .. | .. | .. | .. | |
| G | .. | .. | .. | .. | .. | .. | .. | .. | .. | .. | .. | .. | .. | .. | .. | .. | .. | .. | .. | .. | .. | .. | .. | |
| I | .. | .... | .... | .. | 2 | 3 | .. | 1 | .. | .. | .. | .. | .. | .. | .. | .. | .. | .. | .. | .. | .. | .. | .. | |
| J | .. | . | ... | . | .. | 1 | .. | .. | .. | .. | ... | .. | .. | ... | . | . | . | . | . | . | . | . | .. | |
| K | .. | .. | .. | .. | .. | .. | .. | .. | .. | .. | .. | .. | .. | .. | .. | .. | .. | .. | .. | .. | .. | .. | .. | |
| K | .. | .. | .. | .. | 1 | .. | .. | .. | .. | .. | .. | .. | .. | .. | .. | .. | .. | .. | .. | .. | .. | .. | .. | |
| L | .. | .. | .. | .. | .. | .. | .. | .. | .. | .. | .. | .. | .. | .. | .. | .. | .. | .. | .. | .. | .. | .. | .. | |
| M | .. | .. | .. | .. | . | .. | .. | .. | .. | .. | .. | .. | .. | .. | . | .. | .. | .. | .. | .. | .. | .. | .. | |
| N | .. | .. | .. | .. | .. | .. | .. | .. | .. | .. | .. | .. | .. | .. | . | .. | .. | .. | .. | .. | .. | .. | .. | |
| O | .. | .. | .. | .. | .. | .. | .. | .. | .. | .. | .. | . | .. | .. | .. | .. | .. | .. | 1 | .. | .. | .. | .. | |
| S | .. | .. | .. | .. | .. | .. | .. | .. | .. | .. | .. | .. | .. | .. | .. | .. | .. | .. | .. | .. | .. | .. | .. | |
| .. | ||||||||||||||||||||||||
| 9mm-15mm larvae size range 100.00% | Intermediate 00.00% | 19mm-28mm larvae size range 00.00% | ||||||||||||||||||||||
| Glow
Worms 2014 - a final overview and look ahead to 2015 All in all, 2014 proved to be a good year in terms of Glow Worm numbers at Clipstone Old Quarter, but there continue to be worrying trends and prospects for Glow Worm populations in some of the more isolated sections of the study area. We were able to show how damaging to small invertebrate populations, commercial forestry can be and will continue to be in 2015. The (hopefully) final phase of Pine removal is to take place this Winter, but it is the extraction process which has proved to be most destructive and some of the better Glow Worm areas of Clipstone Old Quarter will be affected by both this and track maintainance. This of course, we will monitor and report on next year. |
|