
| Glow Worms - a detailed summary 2012 |
| 2012 marked our fifth year of coverage of what has now become one of the UK's most important Glow Worm sites. Over the past four years since our surveying became more extensive though, the large colony found at Clipstone Old Quarter in Sherwood Forest, has provided us with a wealth of information and little known facts of what has to be one of our most endearing beetles. | ||
| .... | ||
| This year's surveying at
Clipstone Old Quarter, also coincided with the launch of
our Nottinghamshire Glow Worm Survey in June. The aim of
the survey was simply to find out how common Glow Worms
are, whether they have declined in Nottinghamshire as
part of a continued national decline, or whether they
have always been and still are, just an under-recorded
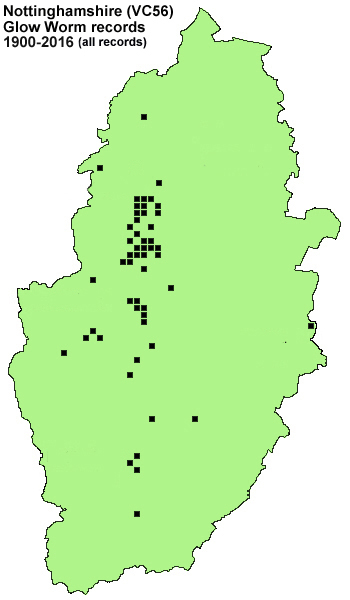
species. The Nottinghamshire Glow Worm Survey 2012 Despite being described as widespread across the UK, a surprisingly very small number of people have actually seen a Glow Worm in Nottinghamshire. We asked many people who live locally, if they had ever seen a Glow Worm and the answer was always a resounding "no". Even people well into their 80's and 90's had never seen one, a fact that surprised us, as we thought that they would be able to relate to us their stories of how they would collect many Glow Worms in jars when they were younger. It seems that although Glow Worms were supposedly once common and widespread, they never really have been in Nottinghamshire and probably never have in many other parts of the UK. Some counties will always have their Glow Worm hotspots and in Nottinghamshire it is the Sherwood Forest area. So in an attempt to try and find out the true county status of the Glow Worm, fellow Glow Worm enthusiast Martin Dale and ourselves, set about visiting the known sites we had grid references for, as part of our Nottinghamshire Glow Worm survey. An appeal for additional help checking sites failed miserably, so we were on our own and although not able to cover all of the sites we knew of, we have made some progress towards achieving our eventual goal of being able to present a clearer picture of the Glow Worm's current Nottinghamshire distribution. We were successful in finally being able to compile a list of all the known Glow Worm sites in the county, so we made positive progress there. A total of all 41 sites were plotted on a map as black dots. It was
interesting that when the map was constructed, the Glow
Worm's Nottinghamshire range, was shown to be restricted
to a relatively narrow strip of the county, running from
north to south. When overlayed onto a map showing county
geology, it showed that virtually all the sites are
located on Sherwood Sandstone. |
 |
|
| .... | ||
| The only Trent Valley
sites are from Colwick and Holme Pierrepont, but survey
efforts at Colwick in 2012 proved negative and the site
now looks unsuitable, but it is a very difficult site to
access and survey properly. Why the Trent Valley is
devoid of Glow Worms is something of a mystery and
colonies could well be found in the next few years. Many
other UK colonies are located on former gravel working
sites, so the gravel working areas of the Trent Valley
would seem ideal, unless the gravel extraction process
has been too detrimental. The county map began to take further shape, when we added red dots to show sites that have produced records since the turn of this century. The lack of red dots was alarming, but has started to prove that this is a beetle in decline and a serious one at that. News of a new Glow Worm site discovered in Clumber Park during July was very welcome and the only new site found this year. Clumber Park is certainly one of the county's three main areas for Glow Worms, the others being Clipstone Forest and the Sherwood Forest NNR. |
||
| .... | ||
 |
Despite covering a large
area, much of the NNR and the two associated SSSI's that
help make the NNR up, is rather devoid of Glow Worms.
Colonies are scattered, but most seem to have survived
since known previous records dating from 1995 or earlier.
But the survival of colonies away from Clipstone Old quarter, is not strong and just a handful of females were recorded during surveys carried out after monitoring the Clipstone Old Quarter colony, which occupied most of the survey time available to us. Surveying other sites has certainly proved to us how important the site is on both local and national levels. It is by far the most well studied colony in the UK, creating an unrivalled accumulation of data. Our daily work there since 2009 has resulted in over 500 site visits, producing over 500 larvae and 2,278 females by the end of the 2012 season. There is still much more to do. During the Winter of 2012/2013, most of the Pines will be felled and there should be a very different look and feel to Clipstone Old Quarter next Spring and Summer. |
|
| .... | ||
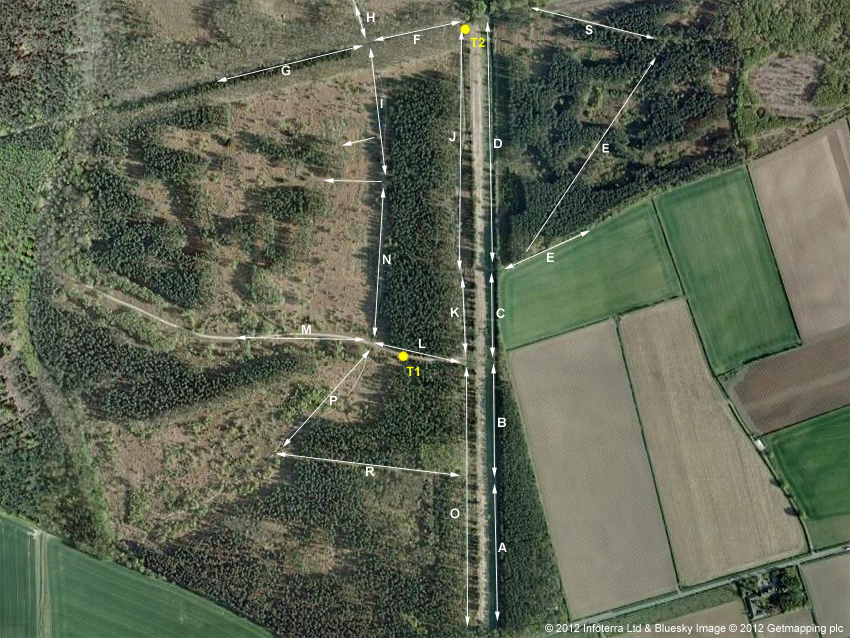
In some ways, such work is potentially interesting as it allows the opportunity to study how such work affects colonies, their numbers and distribution on site. Unfortunately, clear-felled areas are difficult to survey, as Bracken, Bramble and other plant growth, makes these areas almost impossible to survey accurately. In theory, Glow Worms are likely to spread and the colony may thin over many years. Clipstone Old Quarter survey route We already have evidence of Glow Worm movement from certain areas of the site. These have taken place since 2009 and mostly from Glow Worms found in more shaded survey sections and under closed canopy conditions. During the 2012 season, Glow Worms were found in two completely new areas of the site and so the survey route had to be changed to account for this welcome surprise. Adults were found along the new section (section S) and at the top of section E for the first time. In previous years, Glow Worms had only been recorded from the lower part of section E, so we ammended our route to take in the newly extended length of section E. More on the appearance of Glow Worms in these sections will be discussed later, but both had been checked occasionally in previous years and no Glow Worms had been found. Additionally, Glow Worms were found to have spread further along other sections of the site and at peak season, the length of survey time was well in excess of two hours due to the length of the route (over 6.5km) and the number of females per night. An aerial map showing the survey areas on site is produced below. The former survey route taken was area O, R, L, M, N, P, K, J, F, G, H, I, D, E, C, B and finishing in A, but on a few occasions we reversed the route order. |
||
| .... | ||
 |
||
| .... |
| The image of the Clipstone Old Quarter survey route above, measures approximately 1,300 metres from north to south (A-D).The two yellow dots marked T1 and T2, indicate the on-site locations of ground temperature measurements, with T2 being the highest of the two points. The central grid reference for the site is SK 60549 67012. | ||
| In 2012 the change of
survey route meant considerably more walking and was
ammended to the following order that covered all section
O, back up O and along R, P, L, then back up L to M, N,
I, G, H, F, S (shown right), E, C, K, J, D, through C
again, then B and finally A. It was the most efficient survey route we could find, although it meant doubling back up sections L and M and going through section C twice. Producing the survey route may seem unneccessary, but we frequently get asked how we can cover such a large site effectively, so this may help people get a better understanding of how we work the site each night. Of course the start of our surveying usually begins around mid-March, when larvae start to become active after the Winter months. There had been a return to mild Winters again and apart from a very cold spell early in the year, it remained generally mild and relatively dry here throughout. |
 |
|
| .... | ||
| Early
Spring larval survey results and 2012 data Larval surveys take place about an hour before dusk, once the afternoon and evening temperatures generally improves to above 10°C, but very mild weather at the end of February produced two larvae on our first visit to Clipstone Old Quarter on February 28th. Hopes were then high, after such a good start to the season. Several further surveys along sections A, B, C and D of the site in early March, all proved negative. Although a third larva was found on March 11th, it wasn't until March 22nd that persistant surveying commenced, but the number of larvae recorded was low and gave cause for concern that the resulting adult glowing season would actually be our worst ever. A count of 11 larvae on April 30th did raise hopes that our estimates would be wrong, but this remained our only double-figure count of the Spring. The accumulated larval size data from the 66 larvae recorded in Spring 2012 and how the results compare to that from previous years, is shown in the first of set of graphs below. |
||
 |
||
 |
||
 |
||
 |
||
| ..... | ||
| The low numbers were similar to those resulting from surveys in 2009, but the size ratios between 2012 and 2009 are different. Perhaps the most interesting comparisons can be made between 2012 and 2011. Apart from the fact that the number of larvae recorded in both years is extremely different, larvae recorded in 2011 were clearly more advanced in growth during the early weeks of surveying, than they were this year. This is indicated by the lower number of larvae within the two larger size ranges used in the graphs in 2012. Because larvae were more advanced in March and April 2011, that (and favourable weather during the same period) will account for the early season that year. | ||
| ..... |
|
Always looking to
contribute something different to the study of Clipstone
Old Quarter's Glow Worm population, we looked at the
average size of all the larvae found here in Spring since
2009. This proved to be quite interesting and has
revealed some striking differences from year to year,
something that we had not realised before. In 2009 and 2010, the average larval sizes were considerably greater than those recorded in 2011. In 2009, the average larval length was found to be 1.30mm larger than in 2010, but a huge 2.63mm larger than in 2011. 2012 saw an average increase in larval lengths of around 0.50mm over the figures recorded for 2011. Accumulated data in the table is derived from a total of 499 larvae. |
|||||||||||||||||||||||||||||||||||||||||||||||||||||||||||||||||||||||||||||||||||||
| ..... | ||||||||||||||||||||||||||||||||||||||||||||||||||||||||||||||||||||||||||||||||||||||
| The table above shows the averages attained during each weekly period of larval surveying since 2009. The table should be self explanatory, with the average larval lengths shown in millimetres per week. The figure after the forward slash represents the total number of larvae from which the weekly or Spring average is calculated. | ||||||||||||||||||||||||||||||||||||||||||
| ..... | ||||||||||||||||||||||||||||||||||||||||||
| We have looked at the period of April 1st -7th of each survey year, taken the average larval sizes found and then compared them with the recorded rainfall between the months of May to August & September to March. |
|
|||||||||||||||||||||||||||||||||||||||||
| ................. | ||||||||||||||||||||||||||||||||||||||||||
| The rainfall is based on Met Office data for the Midlands area. There seems to be a possible correlation between Spring larval sizes and the amount of rainfall during the preceding 11 months. In the table, we have divided the 11 months into two periods, just to see if the data held up for the preceding Summer, as it seems to do with the preceding Winter. But two other factors to consider are food availabilty (which would be as affected by rainfall as larval growth) and the mean temperature throughout both periods. Adult female Glow Worms very rarely glow when the temperature is below 8°C, so it would be safe to assume that larvae will also be inactive at similar temperatures. | ||||||||||||||||||||||||||||||||||||||||||
| ................. | ||||||||||||||||||||||||||||||||||||||||||
 |
 |
 |
| ..... | ||||||||||||||||||
|
So what of larval sizes
during the rest of the year? We currently have data on a total of 33 larvae found during the period June to August in the past three years (2012 is not included). The average larval lengths are broken down and shown in the right hand table. As before, the figure after the forward slash represents the total number of larvae from which the average is calculated. |
|||||||||||||||||
| ..... | ||||||||||||||||||
| Whilst it is
generally agreed that most larvae take two years to reach
maturity, there are obviously exceptions to the rule,
depending on how much food a larva finds within it's
first three or four months after hatching. Otherwise
adults would be expected to largely occur biannually. It
is very unlikely that larvae can become adult within a
year, but just about theoretically possible that a small
percentage of females emerging in late July of any year,
could have hatched as larvae in June the previous year. Mid-range sized larvae found in June, July and August of any year, will have hatched from eggs laid about a year previous and will continue to grow until passing a second Winter nearly full grown and then completing their growth the following Spring. Several larvae found during surveys for adults, once again provided an interesting observation, when found actively glowing and whilst sat 30cm up a grass stem or similar position and in a manner identical to that of glowing adult females. Is it possible that larvae eventually going on to produce females, occasionally replicate their nocturnal glowing while in the larval stage a year in advance? Larvae glowing in the manner of females is certainly something we have recorded in previous years, when we thought we had found a bright glowing new female, only to find a 13mm larva on closer inspection. We also found hunting larvae glowing within close proximity to glowing adult female Glow Worms. So could larvae going on to develop into males be attracted to glowing adult females? Such theories may sound ridiculous, but we have not been able to come up with any other plausible theories to account for this activity and there must be an explanation for it. |
||||||||||||||||||
| ..... | ||||||||||||||||||
| Female
Glow Worm survey results and 2012 data Despite the low numbers of larvae recorded during our March, April and May surveys, surveying for the first adult females commenced on the early date of May 2nd, with the hope of beating last years early date of May 13th 2011. After all, we had recorded a full grown female larva in late March, so an early emerging female was not entirely out of the question. With a very wet April and early May, it was hardly surprising that it was not until May 30th that Female 001 appeared at the top of section D. First dates for females over the past four years here, have been recorded as follows - May 27th 2009, May 24th 2010, May 13th 2011 and May 30th 2012. Female 001 (F001) on May 30th, turned out to be the first of 599 females to be found during the course of the season, a season that ended with the last appearance of F566 on August 6th. This was a surprisingly large total, given the low number of larvae we had recorded earlier in the year. The 2012 season was eventually notable for several reasons - an unexpectedly high female count, a higher than average number of females recorded each night and a lack of males recorded in cop with females. |
||
| ..... | ||
 |
| ..... | ||
| So it looks like the last week of May is normal for Glow Worms to first appear at Clipstone Old Quarter, but for some reason, this is very early site for Glow Worms in the UK. Having an early site for an invertebrate in the middle of the UK is strange because traditionally, there is the trend for earlier first dates the further south you travel. So why have Glow Worms appeared, peaked and ended at a site in Nottinghamshire, before some southern UK sites have barely even become active? | ||
| ..... | ||
| Unfortunately there are
no other UK sites, from which any kind of comparisons can
be made, but we are proposing to have a recorder
surveying Glow Worms at another Nottinghamshire site
(possibly Sherwood Heath near Ollerton) on a set number
of dates in 2013 and maybe covering the whole of the
second week of June. The second week of June is significant at this site at least, as it marks (with regularity) a sudden emergence of females. This year was no exception and can be seen in the first of the following set of graphs, showing the daily totals of males and females during 2012. A large emergence of females occurred on June 15th (30f) 2012, but there was a significant (though smaller) rise in the number of new females appearing on June 10th (18f). Both these dates fit in remarkably well with similar emergences in previous years of June 9th (47f) and 12th (50f) 2011, June 12th (21f) 2010 and June 8th (63f) 2009. What we don't know is whether large emergences of females occur at other UK sites, or even other sites in Nottinghamshire at around the same time. |
 |
|
| ..... | ||
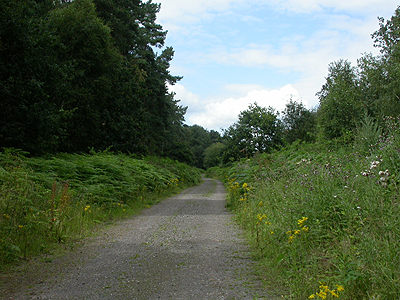
| At Clipstone Old Quarter, females appearing in the grass strip of section D (shown above right) tend to make up the vast majority of these sudden female emergences, as it has the largest population of Glow Worms. The grass strip runs for approximately 1,275 metres and we divide it into four smaller sections, comprising A, B, C and D. Section A can just be seen in the far distance in the photograph above. Sections B and C are not visible because of the slightly lower elevations of both sections. | ||
| ..... | ||
 |
||
 |
||
 |
||
 |
| ..... | ||
| After the
sudden emergence of females in early June, another
feature evident from all the above graphs is a later
(secondary) peak in female numbers. We always regard this
later peak as being the actual peak of the season at
Clipstone Old Quarter. The peak also tends to be more
subtle and not always easy to detect in the graphs,
usually showing up as a gradual build up of numbers,
before a more gradual decline. Looking at the graphs
again, this secondary peak can be seen to have occurred
later (mid-July) in 2012, than it did in 2009, 2010 and
2011, when it was the last week of June. But what is
clearly evident, is that there were really two obvious
peaks in 2012 and note the lack of males recorded with
females compared to previous years. The total number of new females each night are shown in the next four graphs. All we have done to differentiate these from the preceding four graphs, is to remove the male data. |
||
| ..... |
 |
||
 |
||
 |
||
 |
| ..... | ||||||||||||||||||||||||||||||||||||||||||||||||||||||||||||||||||||||||||
| No two seasons are ever
the same and the four graphs showing the numbers of new
females recorded each night detail this extremely well.
The shorter emergence period of females and the higher
than average number of females appearing each night, are
both clearly evident in the 2012 graph. After a rather stuttering start, 2012 saw a continuous emergence of new females from the second week of June, through to the second week of July. There were very few evenings/nights when the number of emergent females was below ten. We have found that this is linked to evenings when the sky has cleared after rain during the day, or early evening and the temperature drops quickly below the 8°C threshold most females require to glow actively. How low evening temperatures affect the glowing of most females (especially when located in grass) shows up well in the graph for 2011 as lower counts. One of the most intriguing aspects of this season, was the extremely low numbers of males we recorded with females. |
|
|||||||||||||||||||||||||||||||||||||||||||||||||||||||||||||||||||||||||
| ..... | ||||||||||||||||||||||||||||||||||||||||||||||||||||||||||||||||||||||||||
| Male Glow Worms
and 2012 data A total of just 41 males found with females would indicate that the actual male population within the colony was unusually low this year. But certainly most females did get mated at some point and even late emerging females stood a chance of successfully attracting a male. Precisely why so few males were not found with females this year in particular, is something of a mystery, as the survey methodology remained exactly the same. Table 01 shows the percentage of females glowing for just one evening before mating during 2012, with tables 01a, 01b and 01c, all showing the percentages for previous years. The percentages in the table were lower this year, with a peak in male activity shown by 70% of females being mated on their first night between June 26th and 29th and the peak was shorter in 2012 than in previous years. Males were also late appearing, judging by the lower than normal percentages of the first 100 females mating on the first night. In fact we never saw a male with a female at all until June 18th and as many males were recorded in flight, producing their characteristic brief flashes. |
|
|||||||||||||||||||||||||||||||||||||||||||||||||||||||||||||||||||||||||
| ..... | ||||||||||||||||||||||||||||||||||||||||||||||||||||||||||||||||||||||||||
|
Finding a
female with a male, did not always mean a successful
mating, as was demonstrated by the following four
females. F142 glowed until June 21st after being found with a male on June 19th; F265 was not seen the night after she was found with a male on June 29th, but then glowed for a further three nights till July 3rd; F339 had a male on June 28th, then glowed for three additional nights out of six before found with another male on July 4th and F591 had a male present on July 25th, but still glowed again the following night. So for some reason or other, mating is not always accomplished at the first attempt, or if it is, some females glow again afterwards. The two most likely reasons are disturbance by ourselves as recorders, or by the position of the female in relation to the vegetation she is glowing from. A thin grass blade, may be difficult for the male to climb and maintain a grip. |
|||||||||||||||||||||||||||||||||||||||||||||||||||||||||||||||||||||||||||||||||
| ..... | ||||||||||||||||||||||||||||||||||||||||||||||||||||||||||||||||||||||||||||||||||
|
|
|||||||||||||||||||||||||||||||||||||||||||||||||||||||||||||||||||||||||||||||||
| ..... | ||||||||||||||||||||||||||||||||||||||||||||||||||||||||||||||||||||||||||||||||||
| The next set of graphs record the number of males found with females each night throughout 2012 and previous years. Once again, the graphs are individual in appearance and there is slight evidence of the double activity peak produced by previous graphs for 2012. If we were to base a summary of the season purely on male activity alone, then describing it as being very late would be accurate. A late June activity peak, is the only consistant feature from all four years. | ||||||||||||||||||||||||||||||||||||||||||||||||||||||||||||||||||||||||||||||||||
| ..... | ||||||||||||||||||||||||||||||||||||||||||||||||||||||||||||||||||||||||||||||||||
 |
||
 |
||
 |
||
 |
| ..... | ||||||
| Deliberate
relocation by female Glow Worms One of the questions we are frequently asked is, how do we know which female is which and do they move?. Its a simple answer, because only a very small percentage of the females recorded throughout the course of a season, will move any more than 30cm during their length of time glowing. Female locations are all marked with a white plant label and numbered and the label looked for each night the female is present. Most movements are limited to a few centimetres and females often show a distinct preference for the same leaf, grass blade or stone etc to glow from. However, during the latter few weeks of every season, some of the more long-lived (glowing) females will occasionally move several feet from their original location. Such movements are a deliberate attempt by the female, to find a more open situation to increase the chances of attracting a male. But not all females go to these lengths and many will continue to persist in glowing from often very dense locations. |
||||||
| ..... | ||||||
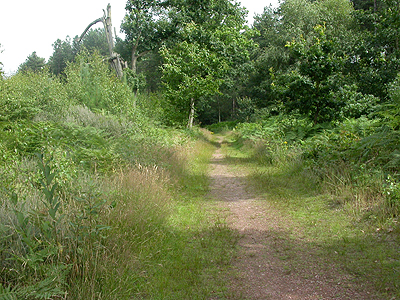
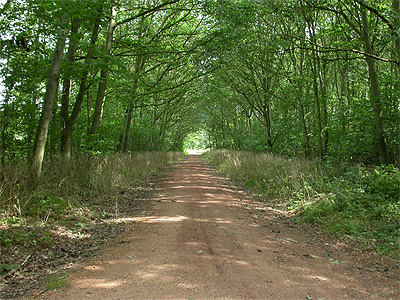
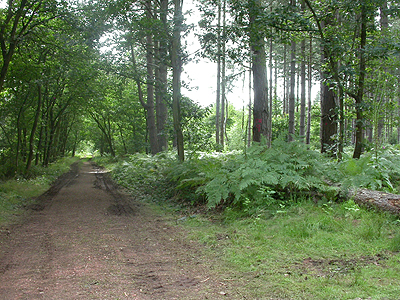
| Females glowing
underneath closed canopy situations, such as those making
up much of sections R, G and F (shown right) will rarely
move from their original locations and even if they did,
the movement it would take to find any area of open
canopy, would be a severe drain on their limited energy
resources, but energy well spent if a male is attracted.
In all probability, there is really no need for a female
to move far in these locations, as these three sections
are the darkest on site, ground cover is limited and so
females easily stand out from over 20 metres away to the
human eye, let alone the significantly more light
sensitive eyes of male Glow Worms. Female movements do occur in these sections though, but only from females that must obviously be aware of some open sky within the tree canopy. These females are invariably found along the forest track edges, often under Bracken or other low vegetation, but where the tree canopy is not closed directly above the middle of the track or path. |
 |
|||||
| .... | ||||||
| We have found many newly emerged females glowing along an imaginary central line the length of the path, obviously having moved there from the original site of pupation. Moving the females to the sides of the track where they are safe from forest traffic, will sometimes see them back in the middle of the path the following night. More often than not though, females will stay close to vegetation growing along the edge of tracks, where they have cover during the day, but from which they can move a few centimetres to glow in the evening. This year, we made the effort to measure and record any large movements shown by late emerging females. | ||||||
| .... | ||||||
| Female No | Section | Distance moved | Date moved | Situation - from/to | Days/nights before move | Mated on |
| ... | ||||||
| F410 | I | 12 feet | 15/07/12 | From under tree to edge of path | 14 days/nights | 16/07/12 |
| F499 | I | 3 feet | 15/07/12 | From deep Bracken towards path. Gradually returned back to original location | 9 days/nights | ... |
| F527 | H | 10 feet | 15/07/12 | From under tree to edge of path | 6 days/nights | 16/07/12 |
| F531 | I | 5 feet | 15/07/12 | From under trees towards edge of path | 5 days/nights | 18/07/12 |
| F534 | F | 6 feet | 17/07/12 | Still under trees | 5 days/nights | 17/07/12 |
| F535 | F | 6 feet | 16/07/12 | Towards edge of path, but still under trees | 4 days/nights | 17/07/12 |
| F537 | E | 8 feet | 17/07/12 | To more open aspect on other side of path | 5 days/nights | 17/07/12 |
| F459 | E | 6 feet | 18/07/12 | From under tree to middle of path. Returned back to edge of path and remained there until 24/07/12 | 13 days/nights | 24/07/12 |
| F477 | J | 3 feet | 18/07/12 | From in grass and Bracken to edge of path | 12 days/nights | ... |
| F586 | G | 12 feet | 24/07/12 | From one side of path to the other. Returned back on 25/07/12 and remained until 28/07/12 | 6 days/nights | 28/07/12 |
| .... | ||||||
| A total of
ten females appearing from mid-July, moved quite
considerable distances and for eight out of the ten, the
result was successfully attracting a male and mating. The
table above charts these females and their movements. The shortest period of time a female spent glowing in dense cover/shade before moving to a more open location was four days/nights by F535. Three females though (F410, F459 and F477) had already spent 12, 13 and 14 days/nights glowing respectively, before deciding to make the move and change their location. F586 moved the most and after being found glowing in the middle of the path, she was transferred to the edge of the path for safety reasons on 19/07/12. On 24/07/12, she was found approximately three metres away on the other side of the track, but had moved the three metres back again by the next night and never moved again. |
||||||
| .... |
 |
By the time two females
made a move to a more open location, males seemed to have
vacated the section they were in or they had become spent
and died. In any section, numbers of unmated females sometimes build. These often remain for several days and nights, but then most seem to get mated and disappear within one or two nights. In previous years we have noticed the disappearance of large numbers of females, perhaps most especially in section D where it can be most obvious after the sudden emergence of good numbers of females. But in 2012, numbers of females in section G and at the top of section E, were virtually cleared out by males overnight. |
|
 |
One explanation could be
that males occasionally emerge in large numbers within a
section, in exactly the same way that females can do and
that males also emerge slightly later than females. One theory that we have discussed with fellow enthusiasts during our surveys, proposes that males actively move from area to area as as the season progresses and the number of available females decreases. It would certainly be expected for males to gradually move greater distances in their search for females, rather than regularly patrol a home territory as many male invertebrates do. |
|
 |
We have mentioned before
in previous summaries about the brief glow seen from
males in flight? The glowing of male Glow Worms seems
little documented, but is certainly real although we know
of no other experienced field workers who have seen it.
Our records of male flashes are always verified by a
second individual wherever possible. On one of our Glow
Worm walks this year, a flash was seen by two people
independent of ourselves as walk leaders. The length of these flashes is as long as it take to read the word 'this'. Its that brief, but occasionally slightly longer and will appear as a very short streak. Most people can see male glows quite easily and it is certainly no trick of the eye. |
|
 |
Something noticed by
ourselves and Martin Dale whilst surveying other
Nottinghamshire sites for Glow Worms this year, was that
if no Glow Worms were on site, no male flashes were
observed, but we were often completely unaware of it
until later. The purpose of glowing in males is a mystery to us. Does it have any purpose at all, or is it just a left over from the evolutionary process? Of course it could be the reverse and something which is still developing among male Glow Worms. Continued evolution within females is also still likely and we believe that some females probably still use pheremones as a method of attracting a male. |
| .... | ||
| Some females seem to be
considerably better at attracting males than others and
we have had numerous instances in the past four years
that would support this theory. Females occasionally
appear and remain unmated for as long as two weeks, even
if glowing brightly in an open location, where visible
detection by males is easy. New females then emerge
(often less than a metre away) and these are mated and
gone within one or two nights, leaving the older female
still glowing. There clearly must be something happening and the most likely explanation would be some use of pheremones, but possibly limited to only a short period of time after emergence. Certainly the brightness of the female glow has as much effect on their chances of mating, as does their choice of glowing location. Some females do not seem to have the ability to glow brightly, even when newly emerged and many old females glowing for perhaps their third week, will gradually glow much fainter as their energy resources lessen. |
 |
|
| .... | ||
| Dim females
are nothing new and we record them in small numbers every
season. F063, F519 and F598 all fell into that category
in 2012 and were very difficult to record, unless aware
of their exact location. An overview of the survey sections We divide Clipstone Old Quarter into 18 different survey sections, recording the emergence of individual females within each section and noting the date on which they appear. Adding up the weekly totals for all the areas, we then produce the results in graph form each year. As the available data builds over time, these graphs should start to show differing trends from across the survey site, trends which cannot be derived from the last set of four graphs showing the highest weekly female counts each year between 2009 and 2012. The table accompanying this section of the 2012 summary, shows the survey section counts of female Glow Worms for each year. The figure after the forward slash, represents the combined total of females for that year. The percentages perhaps represent the most important figures of all here, showing any increases or decreases within the Glow Worm population within any of the 18 survey sections across the site. |
||
| .... | ||
| Section | .. | 2010 | .. | 2011 | .. | 2012 | .. | Population | |||
| .... | .. | Count/Total | Percentage | .. | Count/Total | Percentage | .. | Count/Total | Percentage | .. | |
| A | .. | 017/502 | 3.38% | .. | 032/792 | 4.04% | .. | 036/599 | 6.01% | .. | Increasing |
| B | .. | 034/502 | 6.77% | .. | 046/792 | 5.80% | .. | 041/599 | 6.84% | .. | Stable |
| C | .. | 019/502 | 3.78% | .. | 019/792 | 2.39% | .. | 029/599 | 4.84% | .. | Stable |
| D | .. | 095/502 | 18.92% | .. | 212/792 | 26.76% | .. | 157/599 | 26.21% | .. | Stable |
| E | .. | 000/502 | 0.00% | .. | 019/792 | 2.39% | .. | 053/599 | 8.84% | .. | Increasing |
| F | .. | 023/502 | 4.58% | .. | 030/792 | 3.78% | .. | 011/599 | 1.83% | .. | Declining |
| G | .. | 010/502 | 1.99% | .. | 023/792 | 2.90% | .. | 024/599 | 4.00% | .. | Stable |
| H | .. | 001/502 | 0.19% | .. | 003/792 | 0.37% | .. | 009/599 | 1.50% | .. | Increasing |
| I | .. | 016/502 | 3.18% | .. | 047/792 | 5.93% | .. | 052/599 | 8.68% | .. | Increasing |
| J | .. | 107/502 | 21.31% | .. | 110/792 | 13.88% | .. | 046/599 | 7.67% | .. | Declining |
| K | .. | 035/502 | 6.97% | .. | 046/792 | 5.80% | .. | 005/599 | 0.83% | .. | Declining |
| L | .. | 037/502 | 7.37% | .. | 015/792 | 1.89% | .. | 003/599 | 0.50% | .. | Declining |
| M | .. | 022/502 | 4.38% | .. | 046/792 | 5.80% | .. | 032/599 | 5.34% | .. | Stable |
| N | .. | 033/502 | 6.57% | .. | 059/792 | 7.44% | .. | 040/599 | 6.67% | .. | Stable |
| O | .. | 045/502 | 8.96% | .. | 059/792 | 7.44% | .. | 044/599 | 7.34% | .. | Stable |
| P | .. | 006/502 | 1.19% | .. | 003/792 | 0.37% | .. | 016/599 | 2.67% | .. | Stable |
| R | .. | 004/502 | 0.79% | .. | 022/792 | 2.77% | .. | 012/599 | 2.00% | .. | Stable |
| S | .. | 000/502 | 0.00% | .. | 000/792 | 0.00% | .. | 015/599 | 2.50% | .. | Increasing |
| .. | ||
| After finding Glow Worms
in the new section S and in a completely seperate reach
of section E, all potentially suitable areas immediate to
Clipstone Old Quarter were surveyed during the course of
the Summer. The result was that no other satellite
colonies were found and the nearest other Glow Worms
remain confined to a very small area of the Sherwood
Forest Country Park. The discovery of Glow Worms in this previously unknown area was quite accidental. It was while waiting for a Glow Worm walk to reach Clipstone Old Quarter, that we walked along what was to become section S and found a single glowing female. After leading the public walk, section S was checked properly and an additional female was soon found. It was then a matter of going down towards section E to rejoin the normal survey route, but soon found a group of nine females glowing in close proximity along a densely shaded area of the path. This top area of the (now) extended section E, produced some good numbers over the ensuing evening surveys which followed, but the real mystery was where this colony had originated from. |
 |
|
| .... | ||
| Larvae moving
east from the top of section D was possible, but the
terrain between the two sections is dense Bramble and
Bracken and any progress by larvae moving from section D,
would surely have been too difficult to have been covered
in a few years. This is an area that we had walked at
least once each year since 2009, when we were originally
determining the size of the colony at Clipstone Old
Quarter. Yet we must have missed them, or is this a late
section in which Glow Worms appear? The results gained
from 2012, would seem as though we caught the new area
and section on the point of becoming active, so 2013 will
allow us the chance to assess both more thoroughly. Our
general belief is that Glow Worms have been present in
section S and the top part of section E in small (easily
missed) numbers for many years. Not all sections produced favourable counts during 2012 and there is a continuing downward trend for Glow Worm populations found along sections F, J, K and L. Section K is shown in the above photograph taken in early August and is virtually identical to section J in aspect. Section J did provide 46 females (7.67%) of the seasonal total, but most were confined to one general area, with very few appearing elsewhere along the section. In K and L, it was a very poor season, with both sections producing just eight females between them and contributing less than 1.0% each towards the final total. Of course it is too early to say for sure that Glow Worms are declining in these sections and excessive forest track repair after the car rally in 2011 may be to blame, responsible for covering developing larvae with track spoil last Autumn. |
||
| Section
A Grass (sunny, flat aspect) |
|||
 |
 |
||
 |
|||
| Section
B Grass (sunny, north-facing) |
|||
 |
 |
||
 |
|||
| Section
C Grass (sunny, south-facing) |
|||
 |
 |
||
 |
|||
| Section
D Grass (sunny, south-facing) |
|||
 |
 |
||
 |
|||
| Section
E Forest path (woodland/field edge). |
|||
 |
 |
||
 |
|||
| Section
F.Forest
track (dense shade) |
|||
 |
 |
||
 |
|||
| Section
G.Forest
track (dense shade). |
|||
 |
 |
||
 |
|||
| Section
H Forest
track (partial shade) |
|||
 |
 |
||
 |
|||
| Section
I Minor forest path (enclosed sunny
habitat) |
|||
 |
 |
||
 |
|||
| Section
J Forest track (enclosed habitat,
south facing) |
|||
 |
 |
||
 |
|||
| Section
K.Forest
track (south facing) |
|||
 |
 |
||
 |
|||
| Section L.Forest track (flat aspect). | |||
 |
 |
||
 |
|||
| Section
M Forest
track (flat with open aspect) |
|||
 |
 |
||
 |
|||
| Section
N Minor forest path (south-facing) |
|||
 |
 |
||
 |
|||
| Section
O Forest track (enclosed, generally
north-facing) |
|||
 |
 |
||
 |
|||
| Section
P Forest track (north-facing). |
|||
 |
 |
||
 |
|||
| Section
R Overgrown
grass path (dense shade and flat) |
|||
 |
 |
||
 |
|||
| Section
S Forest
track/path (mostly open and flat, but large section
within Pines and shade) ... |
|||
 |
 |
||
 |
|||
| Section D
remains the heart of the colony in terms of population
rather than situation. In 2011 and 2012, it has provided
over 25% of the total number of females each year. Glow
Worms are presently doing well in all four grass strip
sections and are maintaining their population levels, or
showing an increase like section A, where the percentage
of the population totals has doubled in the last two
years. Glow Worms 2012 - a final overview and look ahead to 2013 This is our fourth summary to detail our surveying and analysis of Clipstone Old Quarter's Glow Worm colony. At the start of the 2011 summary, we wrote . "In four years monitoring this Glow Worm colony, the one and only guaranteed certainty is that when you think you can predict a season's events in advance, this beetle makes you reconsider pretty much everything you thought you knew." . and we could have honestly opened with the same words again this year. |
||
| .... | ||
| After low numbers of
larvae were found in the early Spring, we wrongly
predicted that the total number of adults would be low
and quoted 250 to those who asked how many we thought we
would get. For many UK sites, getting 250 female Glow Worms over the course of a season would probably be rated as extremely good and in terms of Nottinghamshire colonies, such a number from any one site is probably pretty exceptional, or at least we presume it is. In the end, we were just one Glow Worm short from reaching a total of 600 females, which is our second highest count of the past four years of intensive study. The trouble is, recording Glow Worms sufficiently well as to make any data obtained useful, requires dedication and commitment, plus the desire to want to learn about something in the first place. Its very easy to read a book, or browse a website about any aspect of our natural history and then accept that, what is written must be fact without question. |
 |
|
| .... | ||
| Sometimes it is, but to
study something in detail will often produce more
questions than answers, or at least the answers may only
be temporary till more is learnt and a new answer
provided. Study does that, and the Glow Worm has
continued to provide us many new questions these past few
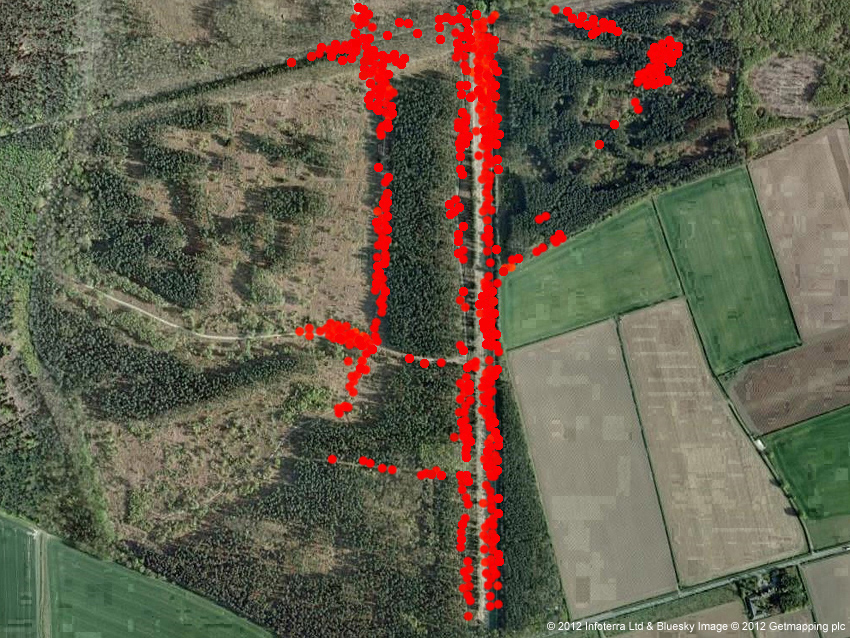
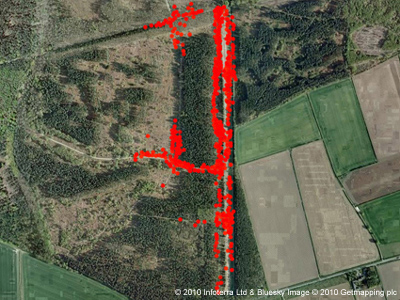
years. It is a shame that this beetle is not widely accessible to many more people. Glow Worm walks organised by the rangers at the Sherwood Forest Visitor Centre prove so popular, the rangers tell us that they could organise a walk every week and it would be over-subscribed each time. There are not many insects that have that effect on the public, even the rarest of species. Although the Glow Worm population at Clipstone Old Quarter is currently doing very well, as shown in the aerial maps from 2010 (above) and 2012, the same does not apply to most of its Nottinghamshire range and surveying has already indicated that Glow Worms have disappeared from many known sites and seemingly at quite a rate. |
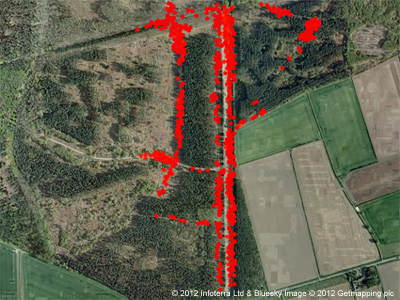 |
|
| .... | ||
| The lastest
data we have, suggests six of Nottinghamshire's former
sites are now classed as 'unsuitable' and that there are
post-2000 records from just 14 out of 42 known sites.
That equates to a present loss of around 66%. Some sites
are on private land, or land currently used for
commercial forestry purposes such as Clipstone Old
Quarter and it looks as though commercial forestry
(especially large-scale cropping) has had an effect on
some known colonies. This coming Winter will see much thinning and removal of the Pines from Clipstone Old Quarter and adjacent plantations in accordance with restoring the site to heathland. So in 2013 the survey site should look very different, more open and exposed, than it has done before. We have been consulted on the work and have advised our recommendations and concerns. Timber removal is the biggest potential problem to Glow Worm and other invertebrate habitat along the forest tracks and paths, so we will have to see what (if any) affect the work has, but climatically it will almost certainly change. Dryness of some exsisting heathland sites has been a problem in the past few years and Glow Worms seem to have been severely affected. It was only as recently as 2008, that we had counts of well over 200 Glow Worms at Sherwood Heath SSSI near Ollerton, but recent years have seen just single females recorded on the occasional nights we have surveyed there since. Maybe 2013 will be better, after what has been a return to wetter weather this Spring and Summer. Potentially having another surveyor recording Glow Worm numbers on Sherwood Heath, will finally provide us the chance of comparison between two sites. Comparison is something we have been lacking and may provide us with some answers to our unanswered questions? It may just give us something more to write about. |
||